Creating visibility is not always a popular topic--especially when that visibility can be used to hold folks accountable. But if you have ever had a network outage due to an incorrect command or change in configuration, it may save your bacon to know how and where to correct it. The same is especially true if a network administrator account is ever compromised.
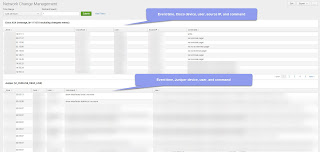
This article will show how to create a running log of searchable commands executed on Cisco ASA and Juniper devices. As a bonus, we will provide the dashboard code at the end of the article.
 |
| Figure 1: Network Change Management dashboard |
Raw Logs
Let's take a moment to see how these logs typically look.Cisco
2017-10-20T08:33:09+00:00 admin : %ASA-5-111010: User 'TONYLEE', running 'CLI' from IP 10.10.10.10, executed 'write terminal'
2017-10-20T04:18:30+00:00 JuniperRTR mgd[91265]: UI_CMDLINE_READ_LINE: User 'TONYLEE', command 'show igmp interface'
Cisco
Logic to Find CLI Commands
We provided the exact Cisco and Juniper packets you are seeking, but these will not be the only packets. This is the logic we used to find it:
index=cisco-asa message_id=111010 command!="changeto*"
Juniper
index=juniper UI_CMDLINE_READ_LINE
Source: https://www.cisco.com/en/US/docs/security/asa/asa80/system/message/logmsgs.html
<form>
<label>Network Change Management</label>
<fieldset submitButton="true" autoRun="true">
<input type="time" token="time" searchWhenChanged="false">
<label>Time Range</label>
<default>
<earliest>-24h@h</earliest>
<latest>now</latest>
</default>
</input>
<input type="text" token="wild" searchWhenChanged="false">
<label>Wildcard Search</label>
<default>*</default>
</input>
</fieldset>
<row>
<panel>
<table>
<title>Cisco ASA (message_id=111010 excluding changeto events)</title>
<search>
<query>index=cisco-asa message_id=111010 command!="changeto*" $wild$ | table _time, host, user, src, command | rename host AS CiscoHost, src as SourceIP</query>
<earliest>$time.earliest$</earliest>
<latest>$time.latest$</latest>
<sampleRatio>1</sampleRatio>
</search>
<option name="drilldown">none</option>
<option name="refresh.display">progressbar</option>
</table>
</panel>
</row>
<row>
<panel>
<table>
<title>Juniper (UI_CMDLINE_READ_LINE)</title>
<search>
<query>index=juniper UI_CMDLINE_READ_LINE $wild$ | table _time, host, user, command, _raw</query>
<earliest>$time.earliest$</earliest>
<latest>$time.latest$</latest>
<sampleRatio>1</sampleRatio>
</search>
<option name="drilldown">none</option>
<option name="refresh.display">progressbar</option>
</table>
</panel>
</row>
</form>
Source: https://www.cisco.com/en/US/docs/security/asa/asa80/system/message/logmsgs.html
Fields to Parse
There are some fields that are critical in terms of making this data useful, such as:- Event time
- Device changed
- Source of change
- User
- Command executed
Fortunately, Splunk should have a Cisco and Juiniper TA to parse these events. If not, respond here and we will help with the regex.
Cisco:
index=cisco-asa message_id=111010 command!="changeto*" $wild$ | table _time, host, user, src, command | rename host AS CiscoHost, src as SourceIP
Juniper:
index=juniper UI_CMDLINE_READ_LINE $wild$ | table _time, host, user, command, _raw
Searches
Now that we have the fields parsed, we need two searches to help us gain visibility into CLI commands:Cisco:
index=cisco-asa message_id=111010 command!="changeto*" $wild$ | table _time, host, user, src, command | rename host AS CiscoHost, src as SourceIP
Juniper:
index=juniper UI_CMDLINE_READ_LINE $wild$ | table _time, host, user, command, _raw
Conclusion
Creating visibility is not always popular, but it sure is helpful when troubleshooting. We hope this article helped others save time. Let us know what you think by leaving a comment below. Happy Splunking!Dashboard Code
The following dashboard assumes that the appropriate logs are being collected and sent to Splunk. Additionally, the dashboard code assumes an index of cisco-asa and an index of juniper. Feel free to adjust as necessary. Splunk dashboard code provided below:
<form>
<label>Network Change Management</label>
<fieldset submitButton="true" autoRun="true">
<input type="time" token="time" searchWhenChanged="false">
<label>Time Range</label>
<default>
<earliest>-24h@h</earliest>
<latest>now</latest>
</default>
</input>
<input type="text" token="wild" searchWhenChanged="false">
<label>Wildcard Search</label>
<default>*</default>
</input>
</fieldset>
<row>
<panel>
<table>
<title>Cisco ASA (message_id=111010 excluding changeto events)</title>
<search>
<query>index=cisco-asa message_id=111010 command!="changeto*" $wild$ | table _time, host, user, src, command | rename host AS CiscoHost, src as SourceIP</query>
<earliest>$time.earliest$</earliest>
<latest>$time.latest$</latest>
<sampleRatio>1</sampleRatio>
</search>
<option name="drilldown">none</option>
<option name="refresh.display">progressbar</option>
</table>
</panel>
</row>
<row>
<panel>
<table>
<title>Juniper (UI_CMDLINE_READ_LINE)</title>
<search>
<query>index=juniper UI_CMDLINE_READ_LINE $wild$ | table _time, host, user, command, _raw</query>
<earliest>$time.earliest$</earliest>
<latest>$time.latest$</latest>
<sampleRatio>1</sampleRatio>
</search>
<option name="drilldown">none</option>
<option name="refresh.display">progressbar</option>
</table>
</panel>
</row>
</form>
No comments:
Post a Comment