By Tony Lee
If you have read some of our other articles you can probably tell by now that we enjoy making data actionable. Honestly, it doesn't matter what type of data or even where the data ends up. As long as we can make informed decisions using the data -- we love it. Following in this theme we are going to make BlackBerry (formerly known as Cylance) Protect Threat Data Report (TDR) CSVs actionable using Power BI and Power BI Desktop. Sure, we could have used excel and some charts here and there, but Power BI is a more suitable fit to creating reusable, decision maker ready, reports. You can use any data source to follow along in this series, but our example BlackBerry Protect report is shown below which we will happily share the Power BI file at the end of the series for you to load and analyze your own data, so stay tuned for that!
 |
| Figure 1: Our Power BI report using BlackBerry Protect TDR data |
In this first article, we will cover:
- Getting Started
- Data Ingest
- Adjusting Fields
- Visualizations
- Saving Your Work
Getting Started
There are many options for using Microsoft's Power BI which are associated with varying costs and features. As a high-level overview:
- Power BI Desktop - Free thick client which can be used to ingest data and design reports
- Power BI Pro - $9.99 monthly per user pricing (included in E5 license)
- Power BI Premium - $4,995 monthly pricing - Enterprise BI big data analytics
- Power BI Mobile - iOS, Android, HoloLens, PC, Mobile Device, Hub apps
- Power BI Embedded - Analytics and visualizations tailored for embedded applications
- Power BI Report Server - On-premises reporting solution, included in premium and can provide hybrid on-prem and cloud capabilities
Source: https://powerbi.microsoft.com/en-us/pricing/
For our learning purposes we used Power BI Desktop to develop our report and Power BI (https://powerbi.microsoft.com) to display it (full screen) in our private workspace. We appear to be using a "free" cloud account and did not upgrade to Pro.
Note: You cannot use a personal account to sign into Power BI. You must use a work or school account. Chances are you probably have one of these accounts and it has some (even free) access to Power BI.
 |
| Figure 2: Power BI ecosystem - Source: https://docs.microsoft.com/en-us/learn/modules/get-started-with-power-bi/1-introduction |
Data Ingest
Now that you have downloaded Power BI Desktop, we need to ingest data. As mentioned at the start of the article, we are using BlackBerry Protect TDR data which is downloaded from the BlackBerry/Cylance portal in a CSV format. Once the data set is downloaded, in Power BI Desktop, click Home > Get Data > Text/CSV and navigate to the file.
 |
| Figure 3: Many options for loading data |
Power BI Desktop did a great job parsing the data in columns with the appropriate header. It even tries to detect the type of data such as string vs. number vs. date.
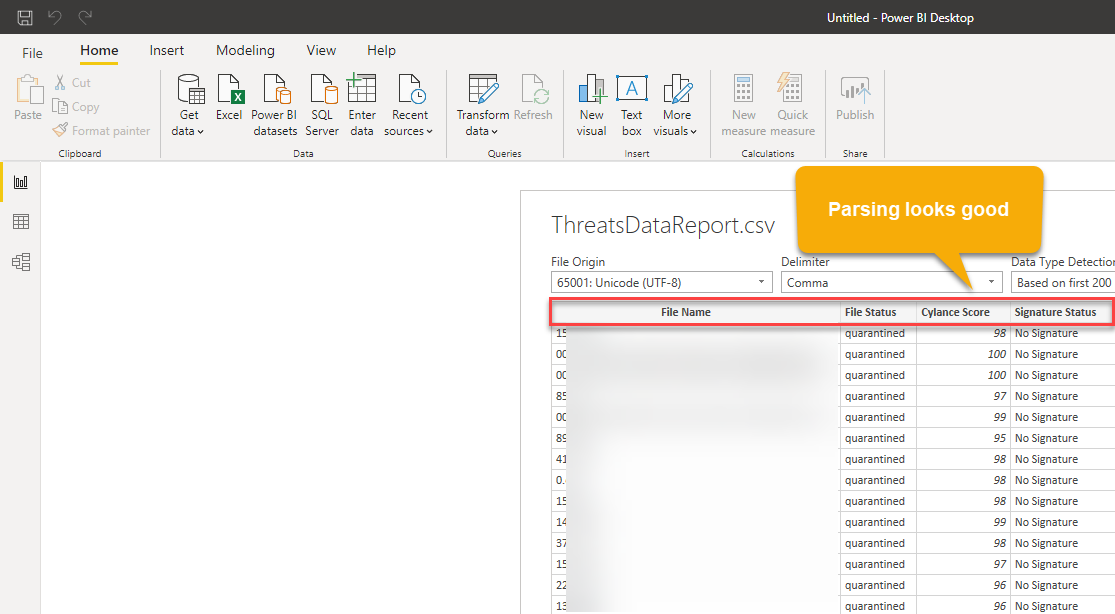 |
| Figure 4: Parsing of fields |
Adjusting Fields
You should now see the fields on the right hand side of the canvas. Note that there may be some instances in which Power BI takes the liberty in summarizing your data--sometimes this is helpful and something it does not make sense to humans. This is understandable since it still takes a human to determine the context around various data fields. A good example is provided when Power BI Desktop tried to sum the BlackBerry/Cylance Protect scores which is of no real value to analysts. "A" for effort though and at least it is correctable by clicking on the parsed field on the right > Column tools > Summarization > Don't summarize.
 |
| Figure 5: Adjusting the parsed fields |
Don't worry about trying to find all of the misinterpreted data up front. You will discover some of these as we start creating visualizations in our report.
Note: Power BI prefers Columnar data, thus spreadsheets that are appealing to the human eye are not always interpreted correctly by Power BI. This level of transforming and manipulating will be left to another article.
Visualizations
What may be most impressive about Power BI is the amount of visualizations available by default. These include (but are not limited to):
- Area charts
- Bar and column charts
- Cards (numeric value)
- Combo charts
- Doughnut charts
- Funnel charts
- Guage charts
- Key influencers chart
- KPIs
- Line charts
- Maps (ArcGIS, filled choropleth, and shape)
- Pie charts
- Ribbon charts
- Treemaps
 |
| Figure 6: Visualization options |
 |
| Figure 7: Created our first visualization - a card that contains the count of events |
Saving Your Work
Now that you have ingested, parsed, and created your first visualization in your report, it is time to save it. Click File > Save As > Name the file. Notice that the file extension is .pbix. Feel free to close Power BI Desktop, re-open your file, and also notice that the data is still there. This indicates that the data is self-contained within the .pbix file -- keep this in mind where sharing your .pbix files with others.
Thanks a lot for sharing.
ReplyDelete