Thursday, July 25, 2019

Wyze Cameras - Keeping Honest Vendors Honest - Part II – Test Results

By Tony Lee

Quick Recap from part I in the series:
It can be difficult for a security nerd to inherently trust cloud vendors and products that do not keep all data on-premises—especially when it comes to home automation IoT devices such as cameras since they can record sensitive data. One such product with excellent reviews, ample capability, and a very reasonable price is the ever-popular Wyze Camera. So, I snatched up a Wyze Cam v2 triple pack that went on-sale, but became concerned after reading reviews and even a Reddit thread found here (https://www.reddit.com/r/wyzecam/comments/beq0sk/do_you_trust_wyze/) and here (https://www.reddit.com/r/wyzecam/comments/7cykgf/wyzecam_sending_data_to_servers_other_than_aws/) mentioning the data is possibly going to China. Note: while no country is perfect, not all countries condone state-sponsored corporate espionage and mass general population data collection.  Just sayin...

One positive note at the time was that it seemed that the manufacturer was chiming in on the Reddit threads explaining that they attempted a fix and that they needed someone to test again. So, in order to test the validity of the reviews and to help answer WyzeTao in the second article:  “We are asking help from some Reddit forum helpers to help check.”, we needed to set up our own environment.  This blog series outlines both the setup involved and then the results.
If you are setting this up yourself, you should refer to Part I - Setup here:   http://www.securitysynapse.com/2019/07/wyze-cameras-keeping-honest-vendors-honest-I.html

Spoiler:
Our camera arrived with firmware version 4.9.2.52 (Release date: October 22, 2018) and we upgraded to the latest version at the time of: 4.9.3.64 (Release date: December 17, 2018). We found that the other reviewers were correct in that the data was going to China (and other countries) due to a content distributor that Wyze useshowever, after working with the very responsive manufacturer, Wyze corrected the issue for everyone. So a huge thanks goes to Tao And Martin at Wyze for their great handling of this responsible disclosure.  Now, please update your mobile app and camera to the latest version (or newer) found below :-)

Corrected Versions:
Mobile app:  V2.4.24 (release date:  July 9th, 2019)
Wyze Cam v2 Firmware V4.9.4.108 (Release date: July 8, 2019)  <-- Update your camera firmware!


Traffic Analysis

After completing the setup in Part I of this series and opening wireshark, it is now time to analyze the traffic. We mentioned previously that we set a display filter (ex:  ip.addr==192.168.8.214) to narrow in on only traffic to and from the Wyze Camera.

Figure 5:  Wyze Cam v2 traffic


As you can see, the Wyze Camera is making DNS requests for:

  • gm.iotcplatform.com
  • cm.iotcplatform.com


These FQDNs resolved to the following IP addresses:
gm.iotcplatform.com

  • 52.79.197.188
  • 50.7.98.242
  • 198.16.70.58


cm.iotcplatform.com

  • 120.24.59.150


Using MaxMind GeoIP2, these IPs are located in the following countries:


Figure 6:  GeoIP resolution


This leaves us with the following:
gm.iotcplatform.com

  • 52.79.197.188 - Incheon, South Korea - Amazon.com
  • 50.7.98.242 - Los Angeles, United States - FDCservers.net
  • 198.16.70.58 - Amsterdam, Netherlands - FDCservers.net 


cm.iotcplatform.com

  • 120.24.59.150 - China - Hangzhou Alibaba Advertising Co.,Ltd.


Traffic Sent

If you were wondering if actual camera traffic was sent through China (via 120.24.59.150), it was indeed.


Figure 7:  Traffic sent to China


That said, the data by default does not use RTSP and could not easily be interpreted. Per Wyze, “The contents are encrypted via AES 128-bit encryption to protect the security of the live stream and playback data. During the connection process, every device in the process has its own secret key and certification, so that we can validate their identity during handshake. Even if a hacker intercepts the data package, the data cannot be decrypted.”

Source:  https://support.wyzecam.com/hc/en-us/articles/360009314072-Security-Privacy- 


Working with Wyze

After reporting the issue to Wyze tech support, they were extremely professional and concerned that the previous patch did not work. They worked quickly to provide a solution and test firmware (test version 4.9.4.44) that appeared to fix the issue.

Instead of the previous firmware querying "gm.iotcplatform.com" and "cm.iotcplatform.com", the new firmware queries "us-master.iotcplatform.com".  Just to be thorough, we let it run a bit and monitored for other traffic and found the following:

api.wyzecam.com

  • 34.208.107.136
  • 35.161.164.220
  • 35.167.190.246


wyze-iot.s3-us-west-2.amazonaws.com

  • 52.218.160.49


a24rq1e5m4mtei-ats.iot.us-west-2.amazonaws.com

  • 35.160.15.131


us-master.iotcplatform.com

  • 50.19.254.134
  • 50.7.98.242

Figure 8:  New GeoIP results


Conclusion

The initial contact took a little while, however over a one month period of working with the vendor, they were able to correct the issue. The level of detail and follow-through was greatly appreciated. Wyze engineers took our concerns seriously and delivered an acceptable solution. Based on our interactions, they appear to be an honest and transparent company that is focused on doing right by their customers. That is just one more reason in my book for us to purchase more Wyze cameras.


Disclaimer:  We do not work for Wyze (or any of the vendors mentioned) and do not benefit from this article in anyway. All cameras were purchased the same as anyone else.  We do like their customer service, quality of the goods, and prices though.  :-)

Monday, July 22, 2019

Wyze Cameras - Keeping Honest Vendors Honest - Part I - Setup

By Tony Lee

Background:
It can be difficult for a security nerd to inherently trust cloud vendors and products that do not keep all data on-premises—especially when it comes to home security/automation IoT devices such as cameras since they can record sensitive data. One such product with excellent reviews, ample capability, and a very reasonable price is the ever-popular Wyze Camera. So, I snatched up a Wyze Cam v2 triple pack that went on-sale, but became concerned after reading reviews and even Reddit threads found here (https://www.reddit.com/r/wyzecam/comments/beq0sk/do_you_trust_wyze/) and here (https://www.reddit.com/r/wyzecam/comments/7cykgf/wyzecam_sending_data_to_servers_other_than_aws/) mentioning the data is possibly going to China. Note: while no country is perfect, not all countries condone state-sponsored corporate espionage and mass general population data collection.  Just sayin...

One positive note at the time was that it seemed that the manufacturer was chiming in on the Reddit threads explaining that they attempted a fix and that they needed someone to test again. So, in order to test the validity of the reviews and to help answer WyzeTao in the second article:  “We are asking help from some Reddit forum helpers to help check.”, we needed to set up our own environment.  This blog series outlines both the setup involved and then the results.

Spoiler:
Since this is a two part series and we want readers to benefit from the latest security enhancements, we are providing a spoiler in the first article. Our camera arrived with firmware version 4.9.2.52 (Release date: October 22, 2018) and we upgraded to the latest version at the time of: 4.9.3.64 (Release date: December 17, 2018). We found that the other reviewers were correct in that the data was going to China (and other countries) due to a content delivery network that Wyze useshowever, after working with the very responsive manufacturer to test and retest, Wyze corrected the issue for everyone. So a huge thanks goes to Tao And Martin at Wyze for listening to customer concerns and their great handling of responsible disclosures. Now, please update your mobile app and camera to the latest versions (or newer) found below :-)

Corrected Versions:
Mobile app:  V2.4.24 (release date:  July 9th, 2019)
Wyze Cam v2 Firmware V4.9.4.108 (Release date: July 8, 2019)  <-- Update your camera firmware too!

Figure 1:  The ever-popular (and pretty awesome) Wyze Cam 1080p HD Indoor Wireless Smart Home Camera

Test Environment

The hardware and software in our environment is a mixture of what we had on hand and what was required to compensate for lack of existing features.  Also keep in mind that there are quite a few ways to test these devices, however we are presenting just one of the solutions here.

Hardware:

  • Wyze Cam v2
  • eero Pro WiFi System (Set of 3 eero Pros) – 2nd Generation
  • GL-iNet AR750s
  • Standard laptop
  • USB Ethernet adapter


Software:

  • Windows 10 base OS
  • Kali Linux OS running in VMWare Workstation with USB ethernet adapter connected as pass through


Quick Note on Limitations of Mesh Routers (Including the Eero Pro WiFi System)

One potentially tricky scenario in monitoring wireless traffic on a mesh network is determining the AP to which the device connects and keeping it on that AP. To avoid that issue, ideally it should be simple to monitor the last hop AP that connects to the source of Internet (cable modem in our case), but this is not always a provided feature. It certainly isn’t a feature in the Eero Pro. Don’t get us wrong, the Eero hardware and reliability makes it one of the best mesh setups around, but the lack of advanced features is depressing—especially for the price tag (~$500) (https://www.amazon.com/eero-Home-WiFi-System-Beacon/dp/B071DWXLYL/). Maybe things will change after the semi-recent Amazon acquisition (https://www.theverge.com/2019/2/11/18220960/amazon-eero-acquisition-announced).  Fingers crossed!

Figure 2:  Typical Mesh network diagram (courtesy of Eero)


Work Around to Sniff Wireless Traffic

Since the Eero woefully lacks a way to route the traffic to a SPAN port, we purchased a GL.iNet GL-AR750S-Ext Gigabit Travel AC Router (https://www.amazon.com/GL-iNet-GL-AR750S-Ext-pre-Installed-Cloudflare-Included/dp/B07GBXMBQF) to do so.  The impressive stats on this compact device are as follows:


  • Dual band AC750 Wi-Fi: 433Mbps(5G) +300Mbps(2.4G)
  • QCA9563,@775MHz SoC
  • 128MB RAM, 16MB NOR Flash and 128 MB NAND Flash
  • Up to 128GB MicroSD slot
  • USB 2.0 port
  • Three ethernet ports (1 WAN, 2 LANs)
  • Powered by Micro USB 5V/2A power supply
  • And best of all:  OpenWrt pre-installed


Configuration and Setup

Now that we know the hardware, let’s jump into it.

Wiring:
 1) Cable Modem --> Wireless router --> Wireless Mesh receiver --> Hardwire to WAN port of AR750s
 2) AR750s Switch port --> USB ethernet adapter (connected to Kali VM)

Figure 3:  Wiring and configuration

First configuration of the router:

  • Power up the router
  • Connect wirelessly using the supplied wireless SSID and default password: goodlife
  • Upon connecting to the web UI (ex: http://192.168.8.1) you will be required to set a password for the router admin


Figure 4:  Web UI that shows the Wyze Cam v2 target and the Kali host to send the SPAN data


Setting up a SPAN port:
 Putty or SSH to router (ex: 192.168.8.1) with proper credentials (ex:  root:<password set above>)
 - Run the following to set up a SPAN port:

Syntax to setup a SPAN port:
iptables -t mangle -A PREROUTING -j TEE --gateway <IP of Kali VM>
iptables -t mangle -A POSTROUTING -j TEE --gateway <IP of Kali VM>

Example (where our Kali VM IP is 192.168.8.217):
iptables -t mangle -A PREROUTING -j TEE --gateway 192.168.8.217
iptables -t mangle -A POSTROUTING -j TEE --gateway 192.168.8.217

NOTE:  If you get the following error:
iptables v1.6.2: unknown option "--gateway"

 - Run the following and then the iptables commands again
opkg update
opkg install iptables-mod-tee kmod-ipt-tee


Figure 5:  SSH into the AR750S and setting up the SPAN port to go to the Kali Linux host (192.168.8.217)


Sniff Traffic:

  • Open Wireshark and sniff on the same interface specified above and you should now see all traffic to and from the AR750S.
  • Pro-tip:  Use a filter in Wireshark to limit traffic to just the device you want to monitor (in our case it is the Wyze Camera)
    • Ex:  ip.addr==<IP ADDRESS>


Conclusion

Now that we covered our hardware, software, setup and how to create a SPAN port of the AR750S wireless traffic… we are ready to cover our findings.  But, we will save that for Part II of the series found here:  http://securitysynapse.blogspot.com/2019/07/wyze-cameras-keeping-honest-vendors-honest-II.html

Tuesday, July 9, 2019

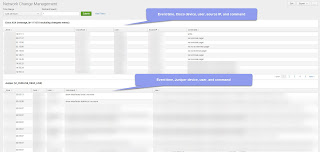
Creating Network Device CLI Visibility in Splunk

By Tony Lee

Creating visibility is not always a popular topic--especially when that visibility can be used to hold folks accountable. But if you have ever had a network outage due to an incorrect command or change in configuration, it may save your bacon to know how and where to correct it. The same is especially true if a network administrator account is ever compromised.

This article will show how to create a running log of searchable commands executed on Cisco ASA and Juniper devices. As a bonus, we will provide the dashboard code at the end of the article.

Figure 1:  Network Change Management dashboard

Raw Logs

Let's take a moment to see how these logs typically look.

Cisco

2017-10-20T08:33:09+00:00 admin : %ASA-5-111010: User 'TONYLEE', running 'CLI' from IP 10.10.10.10, executed 'write terminal'

Juniper

2017-10-20T04:18:30+00:00 JuniperRTR mgd[91265]: UI_CMDLINE_READ_LINE: User 'TONYLEE', command 'show igmp interface'


Logic to Find CLI Commands

We provided the exact Cisco and Juniper packets you are seeking, but these will not be the only packets. This is the logic we used to find it:

Cisco

index=cisco-asa message_id=111010 command!="changeto*"

Juniper

index=juniper UI_CMDLINE_READ_LINE

Source:  https://www.cisco.com/en/US/docs/security/asa/asa80/system/message/logmsgs.html


Fields to Parse

There are some fields that are critical in terms of making this data useful, such as:

  • Event time
  • Device changed
  • Source of change
  • User
  • Command executed

Fortunately, Splunk should have a Cisco and Juiniper TA to parse these events.  If not, respond here and we will help with the regex.


Searches

Now that we have the fields parsed, we need two searches to help us gain visibility into CLI commands:

Cisco:
index=cisco-asa message_id=111010 command!="changeto*" $wild$ | table _time, host, user, src, command | rename host AS CiscoHost, src as SourceIP


Juniper:
index=juniper UI_CMDLINE_READ_LINE $wild$ | table _time, host, user, command, _raw


Conclusion

Creating visibility is not always popular, but it sure is helpful when troubleshooting. We hope this article helped others save time. Let us know what you think by leaving a comment below. Happy Splunking!


Dashboard Code

The following dashboard assumes that the appropriate logs are being collected and sent to Splunk. Additionally, the dashboard code assumes an index of cisco-asa and an index of juniper. Feel free to adjust as necessary. Splunk dashboard code provided below:


<form>
  <label>Network Change Management</label>
  <fieldset submitButton="true" autoRun="true">
    <input type="time" token="time" searchWhenChanged="false">
      <label>Time Range</label>
      <default>
        <earliest>-24h@h</earliest>
        <latest>now</latest>
      </default>
    </input>
    <input type="text" token="wild" searchWhenChanged="false">
      <label>Wildcard Search</label>
      <default>*</default>
    </input>
  </fieldset>
  <row>
    <panel>
      <table>
        <title>Cisco ASA (message_id=111010 excluding changeto events)</title>
        <search>
          <query>index=cisco-asa message_id=111010 command!="changeto*" $wild$ | table _time, host, user, src, command | rename host AS CiscoHost, src as SourceIP</query>
          <earliest>$time.earliest$</earliest>
          <latest>$time.latest$</latest>
          <sampleRatio>1</sampleRatio>
        </search>
        <option name="drilldown">none</option>
        <option name="refresh.display">progressbar</option>
      </table>
    </panel>
  </row>
  <row>
    <panel>
      <table>
        <title>Juniper (UI_CMDLINE_READ_LINE)</title>
        <search>
          <query>index=juniper UI_CMDLINE_READ_LINE $wild$ | table _time, host, user, command, _raw</query>
          <earliest>$time.earliest$</earliest>
          <latest>$time.latest$</latest>
          <sampleRatio>1</sampleRatio>
        </search>
        <option name="drilldown">none</option>
        <option name="refresh.display">progressbar</option>
      </table>
    </panel>
  </row>
</form>


Monday, July 1, 2019

Quick and Flexible IOC Hunting in Splunk

By Tony Lee and Arjun Mathew

Imagine that you are battling a known threat actor.  You have gathered indicators of compromise (IOCs) from reversing malware as well as helpful contributions from the rest of the security community.  But how could those IOCs be tasked across your existing data quickly in order to track attacker movement in real-time?  Here is one possible solution:
  1. Use a lookup file
  2. Clever Splunk search
  3. Even more clever dashboard
This article will outline the process and even share an example dashboard (shown in the screenshot below).

Figure 1:  Known IOC Dashboard provided at the end of the article

Lookup File

We used the following process to create a lookup file and definition.  Create a file in excel and save it as a CSV called known_iocs.csv (similar to the file below).

Figure 2:  CSV that we initially populated with our IOCs

Then within Splunk, navigate to the following to create the lookup and the definition:

Settings > Lookups > Lookup table files > Add new

  • Destination app:  Select the app
  • Upload a lookup file:  known_iocs.csv
  • Destination filename:  known_iocs.csv


Settings > Lookups > Lookup definitions > Add new

  • Destination app:  Select the app
  • Name:  known_iocs.csv
  • Type:  File-based
  • Lookup file:  known_iocs.csv


Now, here is the problem.  How do you scale this solution to a group effort to update a lookup table with IOCs?  It does not work well to pass the CSV around and then constantly upload.  Enter another graceful solution from Luke Murphey -- The Lookup File Editor Splunk App (https://splunkbase.splunk.com/app/1724/).

Figure 3:  Lookup File Editor App from Luke Murphey

Once the Lookup File Editor Splunk App is installed, navigate to it, search for your known_ioc.csv file.  Open it and right click on the bottom line and "Insert a new row".  You can edit the lookup file right in Splunk.  Once it is saved, the correlation searches will automatically run with the new IOC data.


Figure 4:  Inserting a new line to our known_ioc.csv file

Clever Search

Now that we have a lookup table that has our IOCs in it and a convenient way to edit it, we just need a search that will apply the IOCs to our data.  The example below applies the IOCs to the cylance_protect index, but feel free to change the index name as needed.  Additionally, we show how to search just one column of the IOC data as well as multiple columns.


One type of IOC (Hash):

index=cylance_protect [|inputlookup known_iocs.csv | rename Hash as query | table query] | stats count


Two types of IOCs (Hash & FileName)

index=cylance_protect [|inputlookup known_iocs.csv | rename Hash as query | table query] OR [|inputlookup known_iocs.csv | rename FileName as query | table query] | stats count

Note the OR statement between the two inputlookups -- needed when querying multiple columns.


Figure 5:  What will be our top panels showing a count of the hits


Even More Clever Dashboard

Now that we have functional searches, we need a dashboard to monitor our different data feeds such as:
  • Proxy
  • Firewalls
  • DNS
  • Antivirus Hits
  • Email Protection
  • Windows Event Logs

You can see in the screenshot below that we use Single Value panels on the top row.  Each of these panels contains a dynamic drilldown to populate the panel below it with the contents of the Single Value panel when clicked.


Figure 6:  Dashboard displayed at the start of the article and in the Sample Dashboard section below

The drilldown for each Single Value panel sets a token which is essentially the search, but without the stats count (feel free to table the data as needed):

        <drilldown>
          <set token="alert">index=proxy $wild$ [|inputlookup known_iocs.csv | rename Domain as query | table query] | table _raw</set>
        </drilldown>


Then the bottom panel is just a search of the token set in the drilldown above.

        <search>
          <query>| search $alert$</query>
          <earliest>$time.earliest$</earliest>
          <latest>$time.latest$</latest>
        </search>

Conclusion

Using a clever combination of features that already exist within Splunk (for the most part), we were able to create a quick method to update an IOC list and apply it against existing data within Splunk. Simply monitor these dashboards and use it to track the attacker's activities in real-time.


Sample Dashboard

The sample dashboard below uses a number of indexes to search over different data feeds.  Just change these indexes to the ones you are interested in monitoring.


<form>
  <label>Known IOC Hits</label>
  <description>Threat Actor</description>
  <fieldset submitButton="true">
    <input type="time" searchWhenChanged="true" token="time">
      <label>Time Range</label>
      <default>
        <earliest>-24h@h</earliest>
        <latest>now</latest>
      </default>
    </input>
    <input type="text" searchWhenChanged="true" token="wild">
      <label>Wildcard Search</label>
      <default>*</default>
    </input>
  </fieldset>
  <row>
    <panel>
      <single>
        <title>Proxy</title>
        <search>
          <query>index=proxy $wild$ [|inputlookup known_iocs.csv | rename Domain as query | table query] | stats count</query>
          <earliest>$time.earliest$</earliest>
          <latest>$time.latest$</latest>
        </search>
        <option name="colorMode">none</option>
        <option name="drilldown">all</option>
        <option name="rangeColors">["0x65a637","0xd93f3c"]</option>
        <option name="rangeValues">[0]</option>
        <option name="useColors">1</option>
        <drilldown>
          <set token="alert">index=proxy $wild$ [|inputlookup known_iocs.csv | rename Domain as query | table query] | table _raw</set>
        </drilldown>
      </single>
    </panel>
    <panel>
      <single>
        <title>Firewalls</title>
        <search>
          <query>index=firewalls $wild$ [|inputlookup known_iocs.csv | rename IP as query | table query] | stats count</query>
          <earliest>$time.earliest$</earliest>
          <latest>$time.latest$</latest>
        </search>
        <option name="drilldown">all</option>
        <option name="rangeColors">["0x65a637","0xd93f3c"]</option>
        <option name="rangeValues">[0]</option>
        <option name="refresh.display">progressbar</option>
        <option name="useColors">1</option>
        <drilldown>
          <set token="alert">index=firewalls $wild$ [|inputlookup known_iocs.csv | rename IP as query | table query] | table _raw</set>
        </drilldown>
      </single>
    </panel>
    <panel>
      <single>
        <title>DNS</title>
        <search>
          <query>index=dns $wild$ [|inputlookup known_iocs.csv | rename Domain as query | table query] | stats count</query>
          <earliest>$time.earliest$</earliest>
          <latest>$time.latest$</latest>
        </search>
        <option name="drilldown">all</option>
        <option name="rangeColors">["0x65a637","0xd93f3c"]</option>
        <option name="rangeValues">[0]</option>
        <option name="useColors">1</option>
        <drilldown>
          <set token="alert">index=dns $wild$ [|inputlookup known_iocs.csv | rename Domain as query | table query] | table _raw</set>
        </drilldown>
      </single>
    </panel>
    <panel>
      <single>
        <title>Antivirus Hits</title>
        <search>
          <query>index=av $wild$ [|inputlookup known_iocs.csv | rename Hash as query | table query] | stats count</query>
          <earliest>$time.earliest$</earliest>
          <latest>$time.latest$</latest>
        </search>
        <option name="drilldown">all</option>
        <option name="rangeColors">["0x65a637","0xd93f3c"]</option>
        <option name="rangeValues">[0]</option>
        <option name="useColors">1</option>
        <drilldown>
          <set token="alert">index=av $wild$ [|inputlookup known_iocs.csv | rename Hash as query | table query] | table _raw</set>
        </drilldown>
      </single>
    </panel>
    <panel>
      <single>
        <title>Email Protection</title>
        <search>
          <query>index=mail_protection $wild$ [|inputlookup known_iocs.csv | rename Domain as query | table query] | stats count</query>
          <earliest>$time.earliest$</earliest>
          <latest>$time.latest$</latest>
        </search>
        <option name="drilldown">all</option>
        <option name="rangeColors">["0x65a637","0xd93f3c"]</option>
        <option name="rangeValues">[0]</option>
        <option name="useColors">1</option>
        <drilldown>
          <set token="alert">index=mail_protection $wild$ [|inputlookup known_iocs.csv | rename Domain as query | table query] | table _raw</set>
        </drilldown>
      </single>
    </panel>
  </row>
  <row>
    <panel>
      <title>Information Table (Click one of the numbers above to populate this table with Details)</title>
      <table>
        <search>
          <query>| search $alert$</query>
          <earliest>$time.earliest$</earliest>
          <latest>$time.latest$</latest>
        </search>
        <option name="drilldown">cell</option>
      </table>
    </panel>
  </row>
</form>