Showing posts with label CSV. Show all posts

Monday, October 5, 2020

Fun with Microsoft Power BI - Part III - Advanced Ingest and Viewing

 By Tony Lee

Welcome to part III in this series of going from zero to hero using Power BI to ingest, process, and make amazing reports. If you have read some of our other articles you can probably tell by now that we enjoy making data actionable. Honestly, it doesn't matter what type of data or even where the data ends up. As long as we can make informed decisions using the data -- we love it. Following in this theme we are going to make BlackBerry (formerly known as Cylance) Protect Threat Data Report (TDR) CSVs actionable using Power BI and Power BI Desktop. You can use any data source to follow along in this series, but our example BlackBerry Protect report is shown below which we will happily share the Power BI file at the end of the series for you to load and analyze your own data, so stay tuned for that!

Figure 1:  Our Power BI report using BlackBerry Protect TDR data

In the first article, we covered:

  • Getting Started
  • Data Ingest
  • Adjusting Fields
  • Visualizations
  • Saving Your Work
In the second article, we covered:
  • Tabs
  • More Visualizations
    • Text box
    • Slicer
    • Table
    • Pie Charts
    • Treemap
  • Using Reports and Dashboards
  • Uploading Reports to Power BI Service (Online)
In this article, we will cover:
  • Question and Answer (Q&A) Feature
  • Power BI for Mobile
  • Changing the Data Source
  • Scheduling Data Refresh

Question and Answer (Q&A) Feature

Ever wish you could use natural language to ask questions and get answers about your data? In Power BI, you can do just that and even save the resulting visualizations into your report (if you have the necessary permissions). It may take a bit of trial and error, but the results can be both interesting and useful. In Power BI Desktop, this is activated by going to Insert menu > Q&A. In the Power BI Service online interface, click on the report you want and then the "Ask a question" button.

Figure 2: Question and Answer feature of Power BI

Power BI is nice enough to suggest a few questions to ask, however we will list some of our questions below as well.

Example searches include:
  • most recent threats data report
  • count of threats data reports by create time
  • show classification by sha 256, file name as matrix
Figure 3:  Example Q&A


Power BI for Mobile

One of the best features of Power BI is the platform flexibility. Once you build a report and have it available in your workspace, you can view it on nearly any mobile device: Apple, Android, and Microsoft.


We have an Android phone that we used to view the report and try out the filters. The app is available in the play store: https://play.google.com/store/apps/details?id=com.microsoft.powerbim&hl=en_US

 
Figure 4:  Screenshot of our report displayed on a Galaxy Note 8

Changing the Data Source

In our first article, we wanted to keep things simple by uploading a static CSV file. This is great for building the initial report, but it becomes cumbersome to update the data. Fortunately for us, this CSV data came from a simple to use web API which Power BI can easily handle. In fact, Power BI supports a ton of data ingest options such as files, databases, cloud services (over 60 of them!), web APIs, and more. Now let's change our data source from static CSV file to web API, but first let's check the timestamp on the imported file. This can be achieved by hovering over the ThreatsDataReport field.

Figure 5:  Determining staleness and freshness of data


There is an option to refresh the data, but because the original data source is a static CSV, we would need to manually download it again. To change the data source, we need to Edit the query.

Figure 6:  Edit the query to change the source from static file to web query

This opens Power Query Editor. Next we click, Data source settings > Change Source... > Advanced > Then we use the file path parts to first enter the URL and then enter the token on the second line. This file will open the exact same as the static file.

Figure 7:  Changing the data source to using web API

Now that the source is changed to use the web API, we can refresh the data with a click of the button in Power BI using "Refresh data". After checking the timestamp on the new data, the update was successful!

Figure 8:  Refreshing data via the web API


Scheduling Data Refresh

Taking reporting one step beyond a manual refresh, we can also schedule a refresh of the data. In Power BI Service, expand the workspaces to see the Datasets. Click on the three dots next to the Web API data feed and select "Schedule refresh".

Figure 9:  Scheduling a refresh

Under the Schedule refresh menu, turn it on, enter the frequency and even the time to refresh. Another nice touch in this feature is email notification of failure.

Figure 10:  Settings for scheduling a daily data refresh


Conclusion

In this article, we looked at some interesting and more advanced features in Power BI to include the natural language Q&A feature, viewing reports on the Power BI mobile app, converting our static CSV file to update via web API, and finally scheduling the web API dataset to automatically update every day. Power BI is full of features and hopefully you learned something new today. Please feel free to leave feedback and your favorite Power BI features in the comments section below.


Monday, September 28, 2020

Fun with Microsoft Power BI - Part I - Intro

 By Tony Lee

If you have read some of our other articles you can probably tell by now that we enjoy making data actionable. Honestly, it doesn't matter what type of data or even where the data ends up. As long as we can make informed decisions using the data -- we love it. Following in this theme we are going to make BlackBerry (formerly known as Cylance) Protect Threat Data Report (TDR) CSVs actionable using Power BI and Power BI Desktop. Sure, we could have used excel and some charts here and there, but Power BI is a more suitable fit to creating reusable, decision maker ready, reports. You can use any data source to follow along in this series, but our example BlackBerry Protect report is shown below which we will happily share the Power BI file at the end of the series for you to load and analyze your own data, so stay tuned for that!

Figure 1:  Our Power BI report using BlackBerry Protect TDR data

In this first article, we will cover:

  • Getting Started
  • Data Ingest
  • Adjusting Fields
  • Visualizations
  • Saving Your Work

Getting Started

There are many options for using Microsoft's Power BI which are associated with varying costs and features.  As a high-level overview:

  • Power BI Desktop - Free thick client which can be used to ingest data and design reports
  • Power BI Pro - $9.99 monthly per user pricing (included in E5 license)
  • Power BI Premium - $4,995 monthly pricing - Enterprise BI big data analytics
  • Power BI Mobile - iOS, Android, HoloLens, PC, Mobile Device, Hub apps
  • Power BI Embedded - Analytics and visualizations tailored for embedded applications
  • Power BI Report Server - On-premises reporting solution, included in premium and can provide hybrid on-prem and cloud capabilities

Source:  https://powerbi.microsoft.com/en-us/pricing/

For our learning purposes we used Power BI Desktop to develop our report and Power BI (https://powerbi.microsoft.com) to display it (full screen) in our private workspace. We appear to be using a "free" cloud account and did not upgrade to Pro.

Note:  You cannot use a personal account to sign into Power BI.  You must use a work or school account.  Chances are you probably have one of these accounts and it has some (even free) access to Power BI.

Figure 2:  Power BI ecosystem - Source:  https://docs.microsoft.com/en-us/learn/modules/get-started-with-power-bi/1-introduction


Data Ingest

Now that you have downloaded Power BI Desktop, we need to ingest data. As mentioned at the start of the article, we are using BlackBerry Protect TDR data which is downloaded from the BlackBerry/Cylance portal in a CSV format. Once the data set is downloaded, in Power BI Desktop, click Home > Get Data > Text/CSV and navigate to the file.

Figure 3:  Many options for loading data

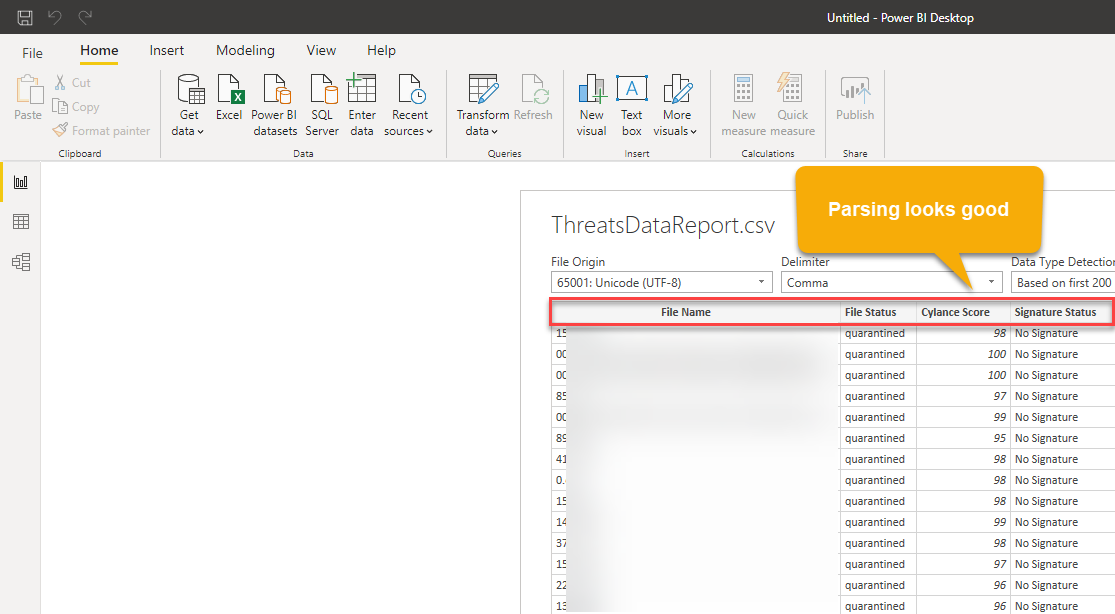
Power BI Desktop did a great job parsing the data in columns with the appropriate header. It even tries to detect the type of data such as string vs. number vs. date.

Figure 4:  Parsing of fields

Adjusting Fields

You should now see the fields on the right hand side of the canvas. Note that there may be some instances in which Power BI takes the liberty in summarizing your data--sometimes this is helpful and something it does not make sense to humans. This is understandable since it still takes a human to determine the context around various data fields. A good example is provided when Power BI Desktop tried to sum the BlackBerry/Cylance Protect scores which is of no real value to analysts.  "A" for effort though and at least it is correctable by clicking on the parsed field on the right > Column tools > Summarization > Don't summarize. 

Figure 5:  Adjusting the parsed fields

Don't worry about trying to find all of the misinterpreted data up front. You will discover some of these as we start creating visualizations in our report.

Note:  Power BI prefers Columnar data, thus spreadsheets that are appealing to the human eye are not always interpreted correctly by Power BI. This level of transforming and manipulating will be left to another article.

Visualizations

What may be most impressive about Power BI is the amount of visualizations available by default. These include (but are not limited to):

  • Area charts
  • Bar and column charts
  • Cards (numeric value)
  • Combo charts
  • Doughnut charts
  • Funnel charts
  • Guage charts
  • Key influencers chart
  • KPIs
  • Line charts
  • Maps (ArcGIS, filled choropleth, and shape)
  • Pie charts
  • Ribbon charts
  • Treemaps
Figure 6:  Visualization options


And the list goes on...  

To start with a simple visualization, let's create a card with the total number of events (in this case it will correlate to the number of rows we have... each row in our data always contains a DeviceName). Begin by clicking anywhere in the canvas and then click the card icon under visualizations. Drag the field you want to count to the Fields box under Visualizations (in our case it was DeviceName). Then click the down arrow and select Count. There are lots of formatting options by clicking on the paint roller under visualizations. We encourage you to explore those settings to achieve your desired look. 

Figure 7:  Created our first visualization - a card that contains the count of events

Saving Your Work

Now that you have ingested, parsed, and created your first visualization in your report, it is time to save it. Click File > Save As > Name the file. Notice that the file extension is .pbix. Feel free to close Power BI Desktop, re-open your file, and also notice that the data is still there. This indicates that the data is self-contained within the .pbix file -- keep this in mind where sharing your .pbix files with others.


Conclusion

In this article, we showed the different options for downloading and using Power BI. Specifically downloading Power BI Desktop and ingesting BlackBerry (Cylance) Protect Threat Data Report data which is in CSV format. Power BI Desktop parsed the data and we showed one potential alteration to the way the data was interpreted. Lastly, we rounded out the article showing how to create your first visualization and save your report locally as a .pbix file. Our follow-on articles will cover more advanced visualizations, relationships, filters, using reports, and uploading reports to Power BI Service (online). Thanks for reading, we hope you enjoyed this introduction to Microsoft's Power BI. Please feel free to leave feedback and your favorite Power BI features in the comments section below.

Monday, July 1, 2019

Quick and Flexible IOC Hunting in Splunk

By Tony Lee and Arjun Mathew

Imagine that you are battling a known threat actor.  You have gathered indicators of compromise (IOCs) from reversing malware as well as helpful contributions from the rest of the security community.  But how could those IOCs be tasked across your existing data quickly in order to track attacker movement in real-time?  Here is one possible solution:
  1. Use a lookup file
  2. Clever Splunk search
  3. Even more clever dashboard
This article will outline the process and even share an example dashboard (shown in the screenshot below).

Figure 1:  Known IOC Dashboard provided at the end of the article

Lookup File

We used the following process to create a lookup file and definition.  Create a file in excel and save it as a CSV called known_iocs.csv (similar to the file below).

Figure 2:  CSV that we initially populated with our IOCs

Then within Splunk, navigate to the following to create the lookup and the definition:

Settings > Lookups > Lookup table files > Add new

  • Destination app:  Select the app
  • Upload a lookup file:  known_iocs.csv
  • Destination filename:  known_iocs.csv


Settings > Lookups > Lookup definitions > Add new

  • Destination app:  Select the app
  • Name:  known_iocs.csv
  • Type:  File-based
  • Lookup file:  known_iocs.csv


Now, here is the problem.  How do you scale this solution to a group effort to update a lookup table with IOCs?  It does not work well to pass the CSV around and then constantly upload.  Enter another graceful solution from Luke Murphey -- The Lookup File Editor Splunk App (https://splunkbase.splunk.com/app/1724/).

Figure 3:  Lookup File Editor App from Luke Murphey

Once the Lookup File Editor Splunk App is installed, navigate to it, search for your known_ioc.csv file.  Open it and right click on the bottom line and "Insert a new row".  You can edit the lookup file right in Splunk.  Once it is saved, the correlation searches will automatically run with the new IOC data.


Figure 4:  Inserting a new line to our known_ioc.csv file

Clever Search

Now that we have a lookup table that has our IOCs in it and a convenient way to edit it, we just need a search that will apply the IOCs to our data.  The example below applies the IOCs to the cylance_protect index, but feel free to change the index name as needed.  Additionally, we show how to search just one column of the IOC data as well as multiple columns.


One type of IOC (Hash):

index=cylance_protect [|inputlookup known_iocs.csv | rename Hash as query | table query] | stats count


Two types of IOCs (Hash & FileName)

index=cylance_protect [|inputlookup known_iocs.csv | rename Hash as query | table query] OR [|inputlookup known_iocs.csv | rename FileName as query | table query] | stats count

Note the OR statement between the two inputlookups -- needed when querying multiple columns.


Figure 5:  What will be our top panels showing a count of the hits


Even More Clever Dashboard

Now that we have functional searches, we need a dashboard to monitor our different data feeds such as:
  • Proxy
  • Firewalls
  • DNS
  • Antivirus Hits
  • Email Protection
  • Windows Event Logs

You can see in the screenshot below that we use Single Value panels on the top row.  Each of these panels contains a dynamic drilldown to populate the panel below it with the contents of the Single Value panel when clicked.


Figure 6:  Dashboard displayed at the start of the article and in the Sample Dashboard section below

The drilldown for each Single Value panel sets a token which is essentially the search, but without the stats count (feel free to table the data as needed):

        <drilldown>
          <set token="alert">index=proxy $wild$ [|inputlookup known_iocs.csv | rename Domain as query | table query] | table _raw</set>
        </drilldown>


Then the bottom panel is just a search of the token set in the drilldown above.

        <search>
          <query>| search $alert$</query>
          <earliest>$time.earliest$</earliest>
          <latest>$time.latest$</latest>
        </search>

Conclusion

Using a clever combination of features that already exist within Splunk (for the most part), we were able to create a quick method to update an IOC list and apply it against existing data within Splunk. Simply monitor these dashboards and use it to track the attacker's activities in real-time.


Sample Dashboard

The sample dashboard below uses a number of indexes to search over different data feeds.  Just change these indexes to the ones you are interested in monitoring.


<form>
  <label>Known IOC Hits</label>
  <description>Threat Actor</description>
  <fieldset submitButton="true">
    <input type="time" searchWhenChanged="true" token="time">
      <label>Time Range</label>
      <default>
        <earliest>-24h@h</earliest>
        <latest>now</latest>
      </default>
    </input>
    <input type="text" searchWhenChanged="true" token="wild">
      <label>Wildcard Search</label>
      <default>*</default>
    </input>
  </fieldset>
  <row>
    <panel>
      <single>
        <title>Proxy</title>
        <search>
          <query>index=proxy $wild$ [|inputlookup known_iocs.csv | rename Domain as query | table query] | stats count</query>
          <earliest>$time.earliest$</earliest>
          <latest>$time.latest$</latest>
        </search>
        <option name="colorMode">none</option>
        <option name="drilldown">all</option>
        <option name="rangeColors">["0x65a637","0xd93f3c"]</option>
        <option name="rangeValues">[0]</option>
        <option name="useColors">1</option>
        <drilldown>
          <set token="alert">index=proxy $wild$ [|inputlookup known_iocs.csv | rename Domain as query | table query] | table _raw</set>
        </drilldown>
      </single>
    </panel>
    <panel>
      <single>
        <title>Firewalls</title>
        <search>
          <query>index=firewalls $wild$ [|inputlookup known_iocs.csv | rename IP as query | table query] | stats count</query>
          <earliest>$time.earliest$</earliest>
          <latest>$time.latest$</latest>
        </search>
        <option name="drilldown">all</option>
        <option name="rangeColors">["0x65a637","0xd93f3c"]</option>
        <option name="rangeValues">[0]</option>
        <option name="refresh.display">progressbar</option>
        <option name="useColors">1</option>
        <drilldown>
          <set token="alert">index=firewalls $wild$ [|inputlookup known_iocs.csv | rename IP as query | table query] | table _raw</set>
        </drilldown>
      </single>
    </panel>
    <panel>
      <single>
        <title>DNS</title>
        <search>
          <query>index=dns $wild$ [|inputlookup known_iocs.csv | rename Domain as query | table query] | stats count</query>
          <earliest>$time.earliest$</earliest>
          <latest>$time.latest$</latest>
        </search>
        <option name="drilldown">all</option>
        <option name="rangeColors">["0x65a637","0xd93f3c"]</option>
        <option name="rangeValues">[0]</option>
        <option name="useColors">1</option>
        <drilldown>
          <set token="alert">index=dns $wild$ [|inputlookup known_iocs.csv | rename Domain as query | table query] | table _raw</set>
        </drilldown>
      </single>
    </panel>
    <panel>
      <single>
        <title>Antivirus Hits</title>
        <search>
          <query>index=av $wild$ [|inputlookup known_iocs.csv | rename Hash as query | table query] | stats count</query>
          <earliest>$time.earliest$</earliest>
          <latest>$time.latest$</latest>
        </search>
        <option name="drilldown">all</option>
        <option name="rangeColors">["0x65a637","0xd93f3c"]</option>
        <option name="rangeValues">[0]</option>
        <option name="useColors">1</option>
        <drilldown>
          <set token="alert">index=av $wild$ [|inputlookup known_iocs.csv | rename Hash as query | table query] | table _raw</set>
        </drilldown>
      </single>
    </panel>
    <panel>
      <single>
        <title>Email Protection</title>
        <search>
          <query>index=mail_protection $wild$ [|inputlookup known_iocs.csv | rename Domain as query | table query] | stats count</query>
          <earliest>$time.earliest$</earliest>
          <latest>$time.latest$</latest>
        </search>
        <option name="drilldown">all</option>
        <option name="rangeColors">["0x65a637","0xd93f3c"]</option>
        <option name="rangeValues">[0]</option>
        <option name="useColors">1</option>
        <drilldown>
          <set token="alert">index=mail_protection $wild$ [|inputlookup known_iocs.csv | rename Domain as query | table query] | table _raw</set>
        </drilldown>
      </single>
    </panel>
  </row>
  <row>
    <panel>
      <title>Information Table (Click one of the numbers above to populate this table with Details)</title>
      <table>
        <search>
          <query>| search $alert$</query>
          <earliest>$time.earliest$</earliest>
          <latest>$time.latest$</latest>
        </search>
        <option name="drilldown">cell</option>
      </table>
    </panel>
  </row>
</form>

Sunday, August 27, 2017

Splunk: The unsung hero of creative mainframe logging

By Tony Lee

The situation

Have you ever, in your life, heard a good sentence that started with: “So, we have this mainframe... that has logging and compliance requirements…” Yeah, me neither. But this was a unique situation that required a quick and creative solution--and it needed to be done yesterday.  Queue the horror music.

In summary:  We needed to quickly log and make sense of mainframe data for reporting and compliance reasons. The mainframe did not support external logging such as syslog. However, the mainframe could produce a CSV file and that file could be scheduled to upload to an FTP server (Not SFTP, FTPS, or SCP).  Yikes!

Possible solutions

We could stand up an FTP server and use the Splunk Universal forwarder to monitor the FTP upload directory, but we did not have extra hardware or virtual capacity readily available. After a quick Google search, we ran across this little gem of an app called the Splunk FTP Reviver app (written by Luke Murphey):  https://splunkbase.splunk.com/app/3318/. This app cleverly creates a python FTP server using Splunk—best of all, it leverages Splunk’s user accounts and role-based access controls.

How it worked

At a high level, here are the steps involved:
  1. Install the FTP Receiver app:  https://splunkbase.splunk.com/app/3318/
  2. Create an index for the mainframe data (Settings -> Indexes -> New -> Name: mainframe)
  3. Create an FTP directory for the uploaded files (mkdir /opt/splunk/ftp)
  4. Create FTP Data input (Settings -> Data Inputs -> Local Inputs -> FTP -> New -> name: mainframe, port: 2121, path: ftp, sourcetype: csv, index: mainframe)
  5. Create a role with the ftp_write privileges (Settings -> Access Controls -> Roles: Add new -> Name: ftp_write, Capabilities: ftp_write)
  6. Create a Splunk user for the FTP Receiver app (Settings -> Access Controls -> Users: Add new -> Name: mainframe, Assign to roles: ftp_write)
  7. Configure the mainframe to send to the FTP Receiver app port (on your own for that one)
  8. Create a local data input to monitor the FTP upload directory and ingest as CSV (Settings -> Data inputs -> Local inputs -> Files and Directories -> New -> Browse to /opt/splunk/ftp -> Continuously monitor -> Sourcetype: csv, index: mainframe)


Illustrated, the solution looks like this:


Figure 1:  Diagram of functional components

If you run into any issues, troubleshoot and confirm that the FTP server is working via a common web browser.


Figure 2:  Troubleshooting with the web browser

Conclusion

Putting aside concerns that the mainframe may be older than most of the IT staff and the fact that FTP is still a clear-text protocol, this was an interesting solution that was created using the flexibility of Splunk. Add some mitigating controls and a little bit of SPL + dashboard design and it may be the easiest and most powerful mainframe reporter in existence.


Figure 3:  Splunk rocks, the process works