Showing posts with label Free. Show all posts

Thursday, August 17, 2017

CyBot – Threat Intelligence Chat Bot

By Tony Lee

Introduction

For those who could not attend, this year’s Black Hat security conference did not disappoint.  It was an awesome time to collaborate and share with the security community.  In doing so, we open sourced a new tool at Black Hat Arsenal at aimed at assisting Security Operations Centers (SOCs) and digital first responders.  We affectionately call it:  CyBot – Threat Intelligence Chat Bot.


We understand that typical SOC environments face a number of challenges:
  • Many SOCs are overwhelmed with the number of incoming alerts
  • Service Level Agreements (SLAs) often define a maximum time to investigate and contain an incident
  • Security tools may be plentiful but they are often not centralized
  • Collaboration on a large investigation may be challenging

We have even seen cases where the SOC receives so many alerts that all of them may not be properly investigated.

To combat this, CyBot can be your threat intelligence chat bot waiting to do research for you.  For example, instead of going to various websites or dashboards to perform research, you could just ask CyBot simple questions and even share results with other investigators.  All from within one chat window you can do the following and more:
·         Ask about the threat reputation of URLs and hashes
·         Perform WHOIS, nslookup, and geoip lookups
·         Unshorten potentially malicious shortened URLs
·         Extract links from a potentially malicious website

CyBot Menu

Best of all, this capability is now free and being actively developed.  All documentation, slides, and plugins have been made publicly available via github:  https://github.com/CylanceSPEAR/CyBot.

Props

Very few tasks are ever accomplished in complete isolation.  Tools, services, and ideas were combined from awesome places such as:
  • Errbot developers for the fantastic tool and customer service
  • VirusTotal
  • geoip - freegeoip.net
  • Google Safebrowsing - https://developers.google.com/safe-browsing/ and Jun C. Valdez Hashid - C0re
  • Unshorten - unshorten.me
  • Codename - https://mark.biek.org/code-name/ Black Hat Arsenal team for the amazing support and tool release venue

  • Non-bots: Bill Hau, Corey White, Dennis Hanzlik, Ian Ahl, Dave Pany, Dan Dumond, Kyle Champlin, Kierian Evans, Andrew Callow, Mark Stevens

Saturday, January 7, 2017

Forensic Investigator Splunk App - Version 1.1.8

By Tony Lee and Kyle Champlin

The latest version of the Forensic Investigator app (version 1.1.8) is now available. We will only cover three major changes, but here are the rest of the details:
  • Added option to hide the MIR menus via the setup screen
  • Added proxy support to setup screen
  • Made vtLookup proxy aware
  • Made vtLookup accept and use non-default API key
  • Added CyberChef (En/Decoder -> CyberChef) - Big thanks to GCHQ for the awesome tool!
  • Added ePO Connector to control McAfee ePolicy Orchestrator
    • Requires editing bin\epoconnector.py and adding ePO IP, port, username, and password

1.  CyberChef

The folks over at GCHQ created an awesome encoding/decoding tool called CyberChef which is available here: https://gchq.github.io/CyberChef/. Even more impressive, it is a stand-alone client-side html page which was released under the Apache License version 2.0. We integrated it into the Forensic Investigator app as a useful component that can be utilized even on closed networks. Huge thanks to the developers at GCHQ.

CyberChef integrated into the Forensic Investigator App

2.  ePO Connector

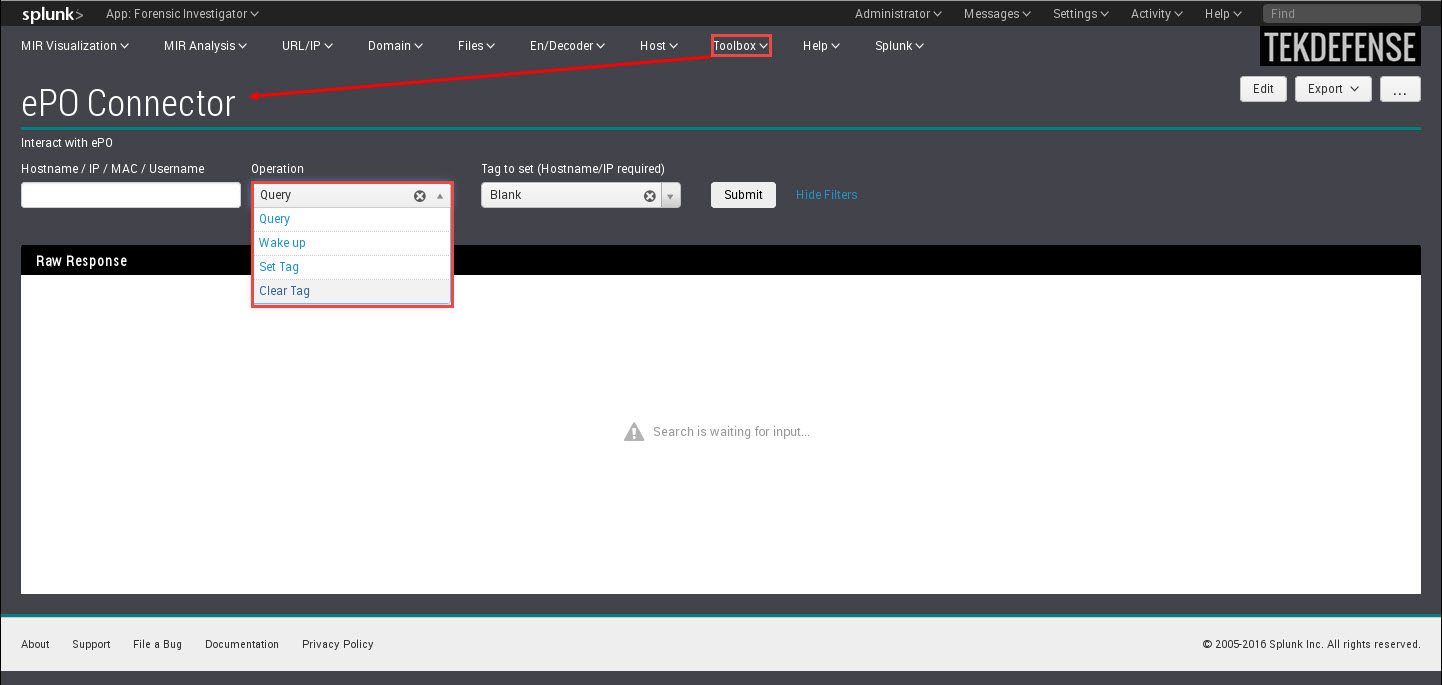
The Forensic Investigator ePO connector can be used to integrate Splunk and McAfee's ePolicy Orchestrator (ePO). This dashboard can task ePO via its API to do the following:
  • Query
  • Wake up
  • Set tag
  • Clear tag
This allows users to query for hosts using a hostname, IP addrses, MAC address, or even username. Then users can set a tag, wake the host up, and even clear a tag.  This feature is covered in more depth here:  http://securitysynapse.blogspot.com/2016/12/splunk-and-mcafee-epo-integration-part-ii.html

ePO connector feature

3.  Proxy Awareness

You spoke and we listened. The Virus Total Lookup feature in the app is now proxy aware. If this feature works well, we will make the rest of the app proxy aware too. To enable the proxy settings, use the setup screen (Help -> Configure App) and enter the required data found in the screenshot.

Proxy setup
Please let us know if you run into any issues with the proxy setup or if it seems to be working well for you.  We will use this information to tweak the setup screen in the next version of the app.

Conclusion 

We enjoy the feedback on the application--both good and bad, so please keep it coming. Let us know how you are using the application and how we can make it better.  Enjoy. :-)

Saturday, September 24, 2016

Splunk Stacking Redline and MIR host-based forensic artifacts

By Tony Lee, Max Moerles, Ian Ahl, and Kyle Champlin

Introduction

Mandiant’s free forensics tool, Redline®, is well-known for its powerful ability to hunt for evil using IOCs, collect host-based artifacts, and even analyze that collected data.  While this gratis capability is fantastic, it is limited to analyzing data from only one host at a time.  But imagine the power and insight that can be gained when looking at a large set of host-based data; especially when the hosts are standardized using a base build or gold disk image.  This would allow analysts to stack this data and use statistics to find outliers and anomalies within the network.  These discovered anomalies could include:

·         Unique services within an organization (names, paths, service owners)
·         Unique processes within an organization (names, paths, process owners)
·         Unique persistent binaries (names, paths, owners)
·         Drive letters/mappings that don't meet corporate standards
·         Infrequent user authentication (such as forgotten or service accounts)

Any of the above example issues could be misconfigurations or incidents--neither of which should be left unnoticed or unsolved.

Requirements and Prototyping

To solve the stacking problem, we had four major requirements.  We needed a platform that could:

1)      Monitor a directory for incoming data
2)      Easily parse XML data (since both Redline and MIR output evidence to XML)
3)      Handle large files and break them into individual events
4)      Apply “big data” analytics to lots of hosts and lots of data


After looking at the requirements and experimenting a bit, Splunk seemed like a good fit.  We started our prototyping by parsing a few output files and creating dashboards within our freely available side project the Splunk Forensic Investigator App.  The architecture looks like the following:

Figure 1:  Architecture required to process Redline and MIR files within Splunk

We gave this app the ability to process just a few Redline and MIR output files such as system, network, and drivers.  Then we solicited feedback and were pleased with the response.

Results

Since the prototype gained interest, we continued the development efforts and the Splunk Forensic Investigator app now handles the following 15 output files:

System
Network
Processes
Services
Ports
Tasks
Prefetch
ShimCache
DNS
User Accounts
URL History
Driver Modules
Persistence
File Listings
Event Logs

After installation and setup, the first dashboard you will see when processing MIR and Redline output is the MIR Analytics dashboard.  This provides heads up awareness of the number of hosts processed, number of individual events, top source types, top hosts, and much more as shown in Figure 2.

Figure 2:  Main MIR Analytics dashboard

Additionally, every processed output type includes both visualization dashboards and analysis dashboards.  Visualization dashboards are designed flush out the anomalies using statistics such as counts, unique counts, most frequent, and least frequent events.  An example can be seen in Figure 3’s visualization example.

Figure 3:  Example visualization dashboard which shows least and most common attributes
The analysis dashboards parse the XML output from Redline and MIR to display it in a human readable and searchable format.  An example can be seen below in Figure 4.

Figure 4:  Example analysis dashboard which shows raw event data

Conclusion

If you use Redline or MIR and would like to stack data from multiple hosts, feel free to download our latest version of the Splunk Forensic Investigator App.  Follow the instructions on the Splunk download page and you should be up and running in no time.  This work can also be expanded to HX, but it will most likely require a bit of pre-processing by first reading the manifest.json file to determine the contents of the randomized file names.  We hope this is useful for other FireEye/Mandiant/Splunk enthusiasts.

Head nod to the "Add-on for OpenIOC by Megan" for ideas:  https://splunkbase.splunk.com/app/1517/