Showing posts with label Forensic Investigator. Show all posts

Saturday, January 7, 2017

Forensic Investigator Splunk App - Version 1.1.8

By Tony Lee and Kyle Champlin

The latest version of the Forensic Investigator app (version 1.1.8) is now available. We will only cover three major changes, but here are the rest of the details:
  • Added option to hide the MIR menus via the setup screen
  • Added proxy support to setup screen
  • Made vtLookup proxy aware
  • Made vtLookup accept and use non-default API key
  • Added CyberChef (En/Decoder -> CyberChef) - Big thanks to GCHQ for the awesome tool!
  • Added ePO Connector to control McAfee ePolicy Orchestrator
    • Requires editing bin\epoconnector.py and adding ePO IP, port, username, and password

1.  CyberChef

The folks over at GCHQ created an awesome encoding/decoding tool called CyberChef which is available here: https://gchq.github.io/CyberChef/. Even more impressive, it is a stand-alone client-side html page which was released under the Apache License version 2.0. We integrated it into the Forensic Investigator app as a useful component that can be utilized even on closed networks. Huge thanks to the developers at GCHQ.

CyberChef integrated into the Forensic Investigator App

2.  ePO Connector

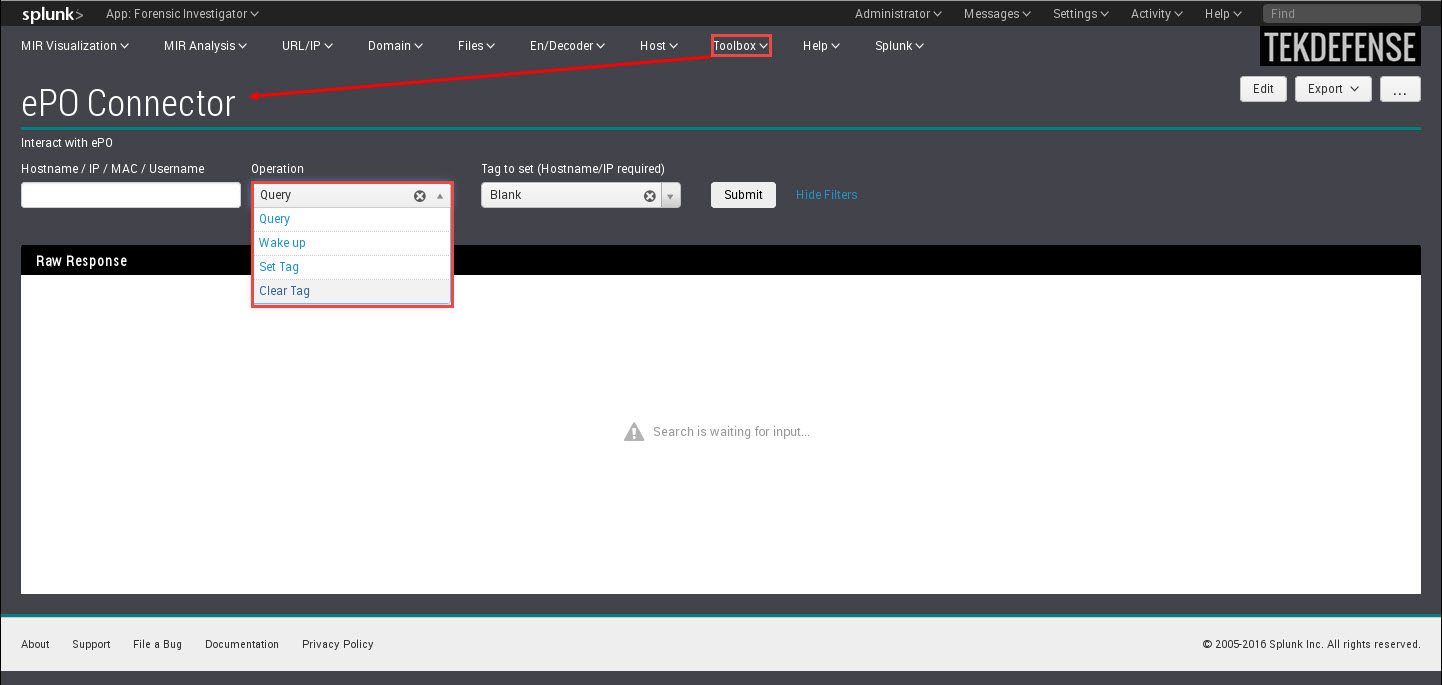
The Forensic Investigator ePO connector can be used to integrate Splunk and McAfee's ePolicy Orchestrator (ePO). This dashboard can task ePO via its API to do the following:
  • Query
  • Wake up
  • Set tag
  • Clear tag
This allows users to query for hosts using a hostname, IP addrses, MAC address, or even username. Then users can set a tag, wake the host up, and even clear a tag.  This feature is covered in more depth here:  http://securitysynapse.blogspot.com/2016/12/splunk-and-mcafee-epo-integration-part-ii.html

ePO connector feature

3.  Proxy Awareness

You spoke and we listened. The Virus Total Lookup feature in the app is now proxy aware. If this feature works well, we will make the rest of the app proxy aware too. To enable the proxy settings, use the setup screen (Help -> Configure App) and enter the required data found in the screenshot.

Proxy setup
Please let us know if you run into any issues with the proxy setup or if it seems to be working well for you.  We will use this information to tweak the setup screen in the next version of the app.

Conclusion 

We enjoy the feedback on the application--both good and bad, so please keep it coming. Let us know how you are using the application and how we can make it better.  Enjoy. :-)

Monday, December 26, 2016

Splunk and McAfee ePO Integration – Part II

By Tony Lee

In our previous article we outlined one method to integrate McAfee's ePolicy Orchestrator (ePO) with Splunk’s flexible Workflow actions. This allows SOC analysts to task ePO directly from Splunk. In this article, we will highlight a different and potentially more user friendly method. For convenience we have integrated this dashboard into version 1.1.8 of the Forensic Investigator app (Toolbox -> ePO Connector).


Forensic Investigator app ePO connector tool

As with the previous article, all that’s needed is the following:
  • Administrator access to Splunk
  • URL, port, and service account (with administrator rights) to ePO

Testing the ePO API and credentials

It still may be useful to first ensure that our ePO credentials, URL and port are correct. Using the curl command, we will send a few simple queries. If all is well, the command found below will result in a list of supported Web API commands.

curl -v -k -u <User>:<Password> "https://<EPOServer>:<EPOPort>/remote/core.help

If this failed, then check your credentials, IP, port, and connection. Once the command works, try the following to search for a host or user:

curl -v -k -u <User>:<Password> "https://<EPOServer>:<EPOPort>/remote/system.find?searchText=<hostname/IP/MAC/User>

Splunk Integration

The Forensic Investigator ePO connector dashboard contains the following ePO capabilities:

  • Query
  • Wake up
  • Set tag
  • Clear tag

This allows users to query for hosts using a hostname, IP addrses, MAC address, or even username. Then users can set a tag, wake the host up, and even clear a tag.

Setup

1)  Download and install
Before this integration is possible, first install the Forensic Investigator app (version 1.1.8 or later).

2)  CLI edit
Then edit the following file:

$SPLUNK_HOME/etc/apps/ForensicInvestigator/bin/epoconnector.py

Set the following:  IP, port, username, and password

theurl = 'https://<IP>:8443/remote/'
username = '<username>'
password = '<password>'

3)  Web UI dashboard edit
The dashboard is accessible via Toolbox --> ePO Connector.  There is a Quarantine tag present by default, but others can be added via the Splunk UI by selecting the edit button on the dashboard.


Lingering concerns

Using this integration method, there are a few remaining concerns:

  • The ePO password is contained in the epoconnector.py python script
    • Fortunately, this is only exposed to Splunk admins.
    • Let us know if you have another solution.  :-)
  • ePO API authentication uses Base64.  The resulting URL can be modified and it will still be authenticated and will issue commands to ePO.
    • SSL should be used with the ePO API to protect the communications
    • Limit this dashboard to only trusted users.
  • Leaving the system.find searchText parameter blank returns everything in ePO
    • ePO seems resilient even to large queries.  We also filtered out blank queries in the python script.
 

Conclusion 

This second ePO integration method should be quite user friendly and can be restricted to those who only need access to this dashboard. It could also be used in conjunction with out previous integration method too. Enjoy!

Saturday, September 24, 2016

Splunk Stacking Redline and MIR host-based forensic artifacts

By Tony Lee, Max Moerles, Ian Ahl, and Kyle Champlin

Introduction

Mandiant’s free forensics tool, Redline®, is well-known for its powerful ability to hunt for evil using IOCs, collect host-based artifacts, and even analyze that collected data.  While this gratis capability is fantastic, it is limited to analyzing data from only one host at a time.  But imagine the power and insight that can be gained when looking at a large set of host-based data; especially when the hosts are standardized using a base build or gold disk image.  This would allow analysts to stack this data and use statistics to find outliers and anomalies within the network.  These discovered anomalies could include:

·         Unique services within an organization (names, paths, service owners)
·         Unique processes within an organization (names, paths, process owners)
·         Unique persistent binaries (names, paths, owners)
·         Drive letters/mappings that don't meet corporate standards
·         Infrequent user authentication (such as forgotten or service accounts)

Any of the above example issues could be misconfigurations or incidents--neither of which should be left unnoticed or unsolved.

Requirements and Prototyping

To solve the stacking problem, we had four major requirements.  We needed a platform that could:

1)      Monitor a directory for incoming data
2)      Easily parse XML data (since both Redline and MIR output evidence to XML)
3)      Handle large files and break them into individual events
4)      Apply “big data” analytics to lots of hosts and lots of data


After looking at the requirements and experimenting a bit, Splunk seemed like a good fit.  We started our prototyping by parsing a few output files and creating dashboards within our freely available side project the Splunk Forensic Investigator App.  The architecture looks like the following:

Figure 1:  Architecture required to process Redline and MIR files within Splunk

We gave this app the ability to process just a few Redline and MIR output files such as system, network, and drivers.  Then we solicited feedback and were pleased with the response.

Results

Since the prototype gained interest, we continued the development efforts and the Splunk Forensic Investigator app now handles the following 15 output files:

System
Network
Processes
Services
Ports
Tasks
Prefetch
ShimCache
DNS
User Accounts
URL History
Driver Modules
Persistence
File Listings
Event Logs

After installation and setup, the first dashboard you will see when processing MIR and Redline output is the MIR Analytics dashboard.  This provides heads up awareness of the number of hosts processed, number of individual events, top source types, top hosts, and much more as shown in Figure 2.

Figure 2:  Main MIR Analytics dashboard

Additionally, every processed output type includes both visualization dashboards and analysis dashboards.  Visualization dashboards are designed flush out the anomalies using statistics such as counts, unique counts, most frequent, and least frequent events.  An example can be seen in Figure 3’s visualization example.

Figure 3:  Example visualization dashboard which shows least and most common attributes
The analysis dashboards parse the XML output from Redline and MIR to display it in a human readable and searchable format.  An example can be seen below in Figure 4.

Figure 4:  Example analysis dashboard which shows raw event data

Conclusion

If you use Redline or MIR and would like to stack data from multiple hosts, feel free to download our latest version of the Splunk Forensic Investigator App.  Follow the instructions on the Splunk download page and you should be up and running in no time.  This work can also be expanded to HX, but it will most likely require a bit of pre-processing by first reading the manifest.json file to determine the contents of the randomized file names.  We hope this is useful for other FireEye/Mandiant/Splunk enthusiasts.

Head nod to the "Add-on for OpenIOC by Megan" for ideas:  https://splunkbase.splunk.com/app/1517/ 

Sunday, May 8, 2016

Forensic Investigator Splunk App - Version 1.1.4

By Tony Lee


Introduction

Our last release, version 1.1.3 was a pretty exciting release with new tools such as the chat program, link extractor, and various monitoring tools.  This time we focused on adding host enumeration tools that can be useful when trying to discover information about a remote host.  In addition, we have added a bulk search option that allows users to search on a list of items such as MD5 hashes, IP addresses or URLs for example.  Here is what we have in store for you in version 1.1.4 which is now available for free via the Splunk App store.

High Level

New Features in v1.1.4
 - Updated Investigator Chat 2.0!
 - Added Ping tool (Host --> Ping)
 - Added SMB Share Viewer (Host --> SMB Share Viewer)
 - Added NetBIOS Viewer (Host --> NetBIOS Viewer)
 - Added Port scanner (Host --> Port Scanner)
 - Added Banner grabber (Host --> Banner grabber)
 - Added Bulk searching of data using any field (Toolbox -> Bulk Search - Wild)
 - Added Bulk searching of data using a specific field (Toolbox -> Bulk Search - Field)
 - Added ASCII Table cheatsheet (Toolbox -> Cheat sheets -> ASCII Table)
 - Added Ports and services cheatsheet (Toolbox -> Cheat sheets -> Ports and Services)
 - Added subnetting cheatsheet (Toolbox -> Cheat sheets -> Subnetting)

Maintenance in v.1.1.4
 - Renamed the xml files to increase simplicity

Investigator Chat 2.0

The chat program received a pretty slick upgrade that makes it much more functional and easier to use.  Big thanks to Kyle for that upgrade.  It now lacks the annoying 5 second refresh rate.


Host Tools

Secure environments will lock down command prompts and restrict access to certain tools--thus it can be useful to have some host enumeration tools that can be activated through Splunk to query remote hosts.

Ping Tool

This is the simplest tool to reach out and see if the host is alive.  The assumption is that ICMP is not blocked at the network or host.


SMB Share Viewer

It can be nice to check for Windows shares as well.  If run from Windows, it will use net view and will not see "hidden" shares (those that end in a $ sign, such as C$, ADMIN$, IPC$).  If run from Linux, it will use smbclient and will see hidden shares.


NetBIOS Viewer

It is also useful to be able to pull NetBIOS table information from a remote host to determine function, users, domain and more.


Port Scanner

Determining the open ports can also be useful for determining the function of a host.  Unfortunately, nmap or other port scanners may not always be available... so we provided a python based port scanner exposed through Splunk.


Banner Grabber

Taking it a step further, we added a python based banner grabber as well.  It should be able to pull most banners, but let us know if it struggles against a particular service.


Bulk Searching - Wild and specific field


Often we have a large list of MD5 hashes, IP addresses, or URLs to run through Splunk.  We could search one item at a time, but that is slow.  We could create a complex boolean statement, but that takes time.  How about just copying and pasting that list into a search field?  Perfect!  This has been tested with Chrome and Firefox which seems to work best.  The file should contain one search item per line.  When copied and pasted into the Splunk Search list field, the browser should separate the terms with spaces.  There are two versions, one which you must specify the field and one that will search all fields (wild).


Cheatsheets - ASCII table, Ports and services, Subnetting


Finally, everyone can use some cheatsheets.  Quick references such as an ASCII table, ports and services, and subnet information.  No more wasting time searching the Internet--especially if you are on a closed network.  These are now local references available in Splunk.


Conclusion

Hopefully you will enjoy the new features of the app.  As always, we appreciate the great feedback we are receiving.  Please send more ideas from within the app using Help --> Send Feedback.

Thursday, April 14, 2016

Forensic Investigator Splunk App - Version 1.1.3

By Tony Lee


Introduction

It has been a little while since we released new features in the Forensic Investigator Splunk App, so we are excited about the latest update.  We have received excellent feedback on the app and have also been brainstorming some ideas for new tools to include.  Here is what we have in store for you in version 1.1.3 which is now available for free via the Splunk App store.

High Level

New Features
 - Added a chat program for collaboration!  It is a first stab, but give it a try (Help -> Chat Program)
 - Added an additional whois lookup vendor - api.hackertarget.com - ex: http://api.hackertarget.com/whois/?q=splunk.com
 - Added a link extractor to rip links out of a page (URL/IP -> Link Extractor)
 - Added permalink information to VT lookup page
 - Added disk usage monitor (Help -> Disk Monitor)  (Uses REST API)
 - Added license analysis page (Help -> License Usage) (*Need to have _internal logs on indexer and role based access)

Bug Fixes
 - Fixed VT lookup script, incorrectly detecting MD5 hashes in URL - if (re.findall(r"(^[a-fA-F\d]{32})", sys.argv[1]))
 - Fixed VT Lookup script, removed leading white spaces lstrip()
 - Fixed bug in BulkWhois to provide state/province information


Chat Program

This is a first stab at a collaboration mechanism within Splunk.  It works for a quick and dirty.  The only annoyance is the refresh every 5 seconds.  I am sure it can be made fancier with some Java Script so if you do a little dev and want to contribute--we would appreciate it.


Additional WHOIS vendor

For a while, it appears that bulkwhois had an ISP issue.  Thus, we added a second provider as another option.  Big thanks to hackertarget.com.


Link Extractor

This is useful if you don't want to visit a potentially malicious site, but you want to know the links on the site.  This tool will rip all of the links from the page safely and quickly.


Disk Usage

This last tool is useful for those who need to monitor how much storage is left on their indexers.  This is customizable to your server name and volume that holds indexed data.  By default it is set to my development box which is a simple Kali VM.


Conclusion

Hopefully you will enjoy the new features of the app.  As always, we appreciate the great feedback we are receiving.  Please send more ideas from within the app using Help --> Send Feedback.

Monday, February 15, 2016

Processing Mandiant Redline Files Using Splunk

By Tony Lee

Introduction

Do you use Mandiant's Redline (https://www.fireeye.com/services/freeware/redline.html) for performing host investigation?  Do you use Splunk for centralized log collection and monitoring?  How about using these two tools together?  The team behind the Splunk Forensic Investigator app (https://splunkbase.splunk.com/app/2895/) is experimenting with ingesting Redline collections.  We have made good progress on proving that it is possible to automate the ingestion of Redline collections and use Splunk to carve and display data from multiple hosts at the same time.  However we were wondering how many people would find this capability useful enough to see the work completed.  Check out the prototyping below and let us know if you would find this useful by leaving a comment below (account not necessary).

We have example output below:

System info displayed in Redline


System info displayed in Splunk


Driver modules displayed in Redline


Driver modules displayed in Splunk


Above and beyond replication

Recreating the Redline output is all well and good, however keep in mind that ingesting the data into Splunk allows you to filter, search, and carve across multiple systems at the same time.  Additionally, it would allow you to use Splunk's big data crunching capabilities.  It is very simple to ask Splunk to apply statistical analysis to large data sets to help look for anomalies within hosts such as:
  • Drive letters/mappings that don't meet corporate standards
  • Logged in/on users that occur infrequently (such as service accounts)
  • Forgotten operating systems that may be weak points or exploited first within a network


Or when analyzing drivers on multiple hosts, an investigator could glance at a dashboard and determine any of the following and more:
  • Number of drivers per host
  • Largest driver
  • Smallest driver
  • Most common driver file name
  • Most common driver path
  • Least common driver file name
  • Least common driver path

Conclusion

 These are just some examples of interesting data one might pull from analyzing many collections.  The possibilities are probably endless.  Let us know what you think.  Thanks.