By Tony Lee
In our
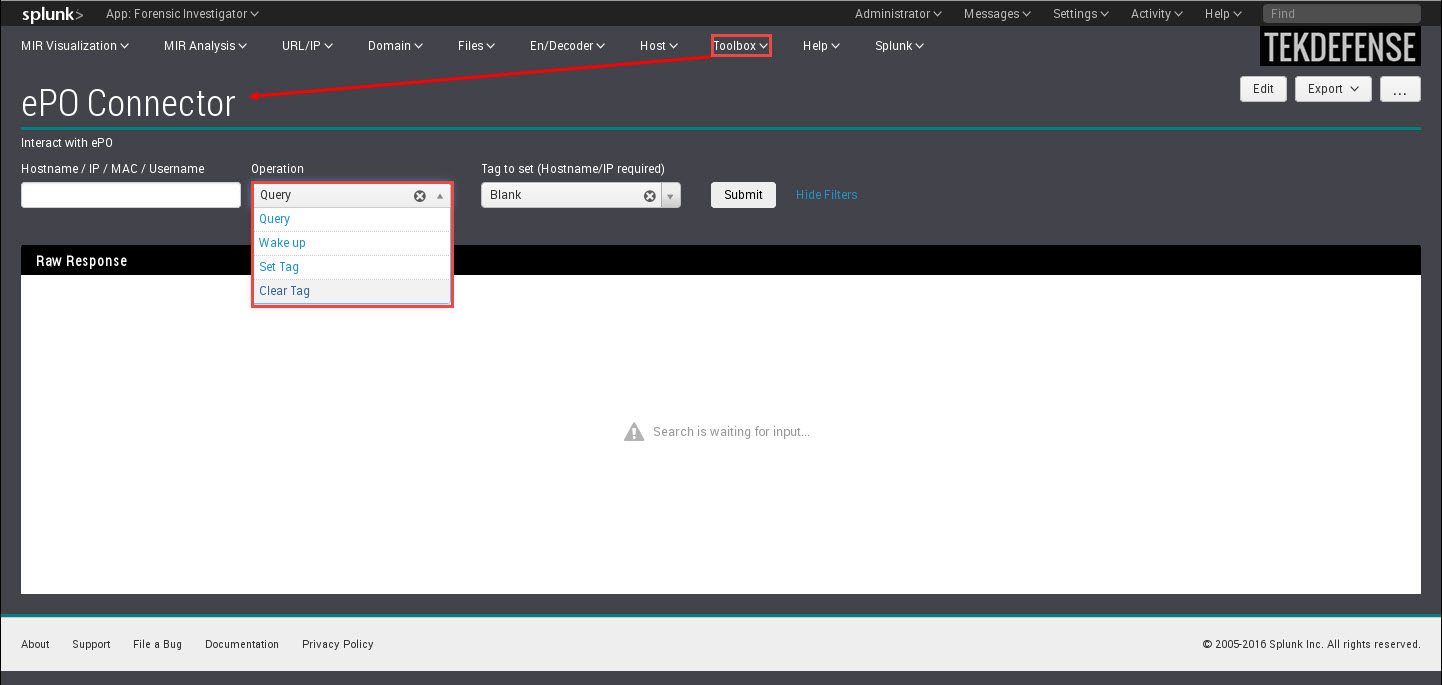
previous article we outlined one method to integrate McAfee's ePolicy Orchestrator (ePO) with Splunk’s flexible Workflow actions. This allows SOC analysts to task ePO directly from Splunk. In this article, we will highlight a different and potentially more user friendly method. For convenience we have integrated this dashboard into version 1.1.8 of the
Forensic Investigator app (Toolbox -> ePO Connector).
 |
| Forensic Investigator app ePO connector tool |
As with the previous article, all that’s needed is the following:
- Administrator access to Splunk
- URL, port, and service account (with administrator rights) to ePO
Testing the ePO API and credentials
It still may be useful to first ensure that our ePO credentials, URL and port are correct. Using the curl command, we will send a few simple queries. If all is well, the command found below will result in a list of supported Web API commands.
curl -v -k -u <User>:<Password> "https://<EPOServer>:<EPOPort>/remote/core.help
If this failed, then check your credentials, IP, port, and connection. Once the command works, try the following to search for a host or user:
curl -v -k -u <User>:<Password> "https://<EPOServer>:<EPOPort>/remote/system.find?searchText=<hostname/IP/MAC/User>
Splunk Integration
The Forensic Investigator ePO connector dashboard contains the following ePO capabilities:
- Query
- Wake up
- Set tag
- Clear tag
This allows users to query for hosts using a hostname, IP addrses, MAC address, or even username. Then users can set a tag, wake the host up, and even clear a tag.
Setup
1) Download and install
Before this integration is possible, first install the
Forensic Investigator app (version 1.1.8 or later).
2) CLI edit
Then edit the following file:
$SPLUNK_HOME/etc/apps/ForensicInvestigator/bin/epoconnector.py
Set the following: IP, port, username, and password
theurl = 'https://<IP>:8443/remote/'
username = '<username>'
password = '<password>'
3) Web UI dashboard edit
The dashboard is accessible via Toolbox --> ePO Connector. There is a Quarantine tag present by default, but others can be added via the Splunk UI by selecting the edit button on the dashboard.
Lingering concerns
Using this integration method, there are a few remaining concerns:
- The ePO password is contained in the epoconnector.py python script
- Fortunately, this is only exposed to Splunk admins.
- Let us know if you have another solution. :-)
- ePO API authentication uses Base64. The resulting URL can be modified and it will still be authenticated and will issue commands to ePO.
- SSL should be used with the ePO API to protect the communications
- Limit this dashboard to only trusted users.
- Leaving the system.find searchText parameter blank returns everything in ePO
- ePO seems resilient even to large queries. We also filtered out blank queries in the python script.
Conclusion
This second ePO integration method should be quite user friendly and can be restricted to those who only need access to this dashboard. It could also be used in conjunction with out previous integration method too. Enjoy!