Showing posts with label API. Show all posts

Thursday, October 15, 2020

VirusTotal Lookups in Microsoft Power BI - Processing JSON

 By Tony Lee

So we are on this Power BI binge... and figured a VirusTotal lookup report and dashboard would be useful as a stand alone tool as well as a drill through fed by other reports. Presented below are the results of our efforts, steps we took, and limitations we encountered (as newbz). In typical form, we released the work for free so everyone can use, contribute, and modify as they see fit.  Enjoy!:

https://github.com/TonyLeeVT/VirusTotal-PowerBI-Lookup/

Figure 1:  Resulting VT Lookup report in Power BI

Features

Let's start with what this report provides -- from top left to bottom right:

  • Slicer (filter) to filter on engines that hit or missed the sample
  • Permalink to the results
  • Gauge to indicate number of hits vs engines
  • Verbose message from VT
  • What Resource we actually queried
  • MD5, SHA1, and SHA256 hash values
  • Table of engines, conviction results, malware classification, engine update, and engine version
  • Treemap of conviction results - useful for determining the highest malware family consensus

Process

At a high-level, here is what we did to create the dashboard:

  1. Created a parameter that holds the Resource we want to look up
  2. Used "Get Data" to query the VT API to pull in the JSON response
  3. Used Power Query Editor to manipulate and extract the nested JSON as needed
  4. Built a cool dashboard in Power BI Desktop
Since there are some intricate details in processing JSON data, we figured we would break down the steps in a bit more detail.

Creating the Parameter


We created two parameters to prompt users for data.  The first is the VT API key and the second is the hash they want to query.  Parameters are created in Power Query Editor by clicking on the down arrow for Manager Parameters > New Parameter

Name the field, Add a description, select Text for the Type, and enter a hash you know VT has for the Current Value.  In our example, we used the hash:  0a52fdc2219346d25295c8d6838122bcdd7ddf119386cd1030458b035cd97999


Figure 2:  Creating and managing the parameter that stores the query value

Note:  We also created a parameter for the API key so the user is prompted for the key when opening the Power BI template for the first time. When this is saved as a .pbix, the parameter value is also saved making it easy to use by the team.

Creating the VirusTotal Web API call for Get Data

To create the Web API call perform the following:
  • Get Data > Web
  • Advanced
  • URL parts:
    • https://www.virustotal.com/vtapi/v2/file/report?
    • apikey=
    • Select Parameter from the dropdown and use API_Key
      • Note:  The free VT API key can be used
    • &resource=
    • Select Parameter from dropdown and use "Resource"

Figure 3:  Creating API call to VirusTotal to get the JSON data

Note:  The data returned will be JSON.  Now we need to make it columnar.


Use Power Query Editor to Manipulate the JSON

When the JSON formatted data is returned from the VirusTotal API query, follow these steps to make it columnar:

Convert > Into Table

Figure 4:  Convert JSON to a table


Transform > Transpose > Use First Row as Headers

Figure 5:  Transposed the table and then used the first row as the header


Take note!  The field called scans has a value of: "Record".  When clicking on this object, it expands below revealing the results of each scan vendor. Notice that those values are also "Record" which means we have two nested JSON objects, one inside the other.  We will need to make both columnar data to use it in Power BI.

Figure 6:  The scans field is a JSON object that contains more JSON objects

Expand the scans column

Here is a trick that we learned from a Guy in a Cube video -- thanks for the videos fellas! There is a little double arrow box in the far right portion of the header for scans. If you click this, it will allow you to expand (convert) the JSON to columnar data once again.  Be sure to uncheck the box at the bottom to avoid prepending a prefix that we would strip away later.

Figure 7:  First expansion of JSON object called "scans"

Highlight the antivirus vendor columns > Unpivot Columns

Figure 8:  Unpivoting the antivirus vendor columns to make each entry its own row


Rename Attribute field to Engine

Expand the Value field that contains more nested JSON

Figure 9:  Renaming column header and expanding second JSON object


Rename new columns to remove "Value." in front of detected, version, result, and update.

Building the dashboard

The dashboard consists of a filter, some tables, a gauge, and a treemap. Please see our other Power BI articles on building visualizations. The toughest portion of this task was taking JSON input and making it columnar so it can be processed by Power BI. As a bonus, we are also templating this project and making it available to everyone.

Template

As we just mentioned, we saved this work as a template and will distribute it for free. When opening the template, simply insert your VT API Key (which can be the free API key) and the hash that you want to query (called a resource).

Figure 10:  Templated VirusTotal lookup report in Power BI


Limitations

Currently we believe we have the following limitations, but these may be easy to overcome depending on how many ideas and solutions we can pull from our readers:
  1. Unable to modify hash parameter from report / dashboard to refresh data feed with new data natively from Power BI
  2. Drill through lookup using hash from previous report may be limited due to parameter update issue
  3. Potential for AV column rename to fail due to hard coded AV vendor names in power query
  4. Error handling could be improved for instances where VirusTotal does not have the data
    • "response_code": 0 vs. "response_code": 1

Conclusion

We hope you enjoyed this article and have some ideas for us to correct some of the limitations. Feel free to contribute ideas and help us make this report better by using the comments feature below or submitting pull requests via Github. Or just give us a shout out if you are using this solution.  Enjoy!

Thursday, July 23, 2020

Fun with AWS CLI - Cost Explorer (ce) API

By Tony Lee

If you are an avid Amazon Web Services (AWS) consumer and have been thinking about ways to integrate these services into third party-tools (such as CyBot - https://github.com/cylance/CyBot), you have come to the right place. In this article we will cover how to setup and use the aws2 client (AWS CLI) to easily interact with AWS' APIs.  Per Amazon:  "AWS Command Line Interface (AWS CLI) is an open source tool that enables you to interact with AWS services using commands in your command-line shell."  Our example below will illustrate just one possibility by using the Cost Explorer (ce) API determine your current and past AWS bills via the command line or third-party tool.

In other words, we are ditching the Web interface shown below:

Figure 1:  AWS Billing Web Interface

In favor of querying the information via the command line:

Figure 2:  AWS Billing query via command line

Or better yet, a ubiquitous tool such as your favorite chat application using CyBot:

Figure 3:  Enabling CyBot to query the AWS API
We will cover the following tasks to enable this integration:

  • Configuring AWS Permissions
    • Policy creation
    • Group creation
    • User creation
  • Installing the aws2 client
  • Configuring the aws2 client
  • Using the aws2 client


Cost Estimation Requirements

Before we dive into the configuration steps, there are two main requirements:
  • Access to the following endpoint:  https://ce.us-east-1.amazonaws.com
  • aws2 client
    • A while back, we tried version 1 of the aws client, but it lacked the cost estimator (ce) command, thus we had to upgrade to version 2 (both referenced via the aws command)

Configuring AWS Permissions

Note:  This step generates your AWS Access Key ID and AWS Secret Access Key.  Copy these down in a safe place because you will need this info in the AWS client setup section

First create and retrieve your AWS credentials via IAM:
https://console.aws.amazon.com/iam/home

Policy Creation
Once, authenticated, create a policy to allow only cost estimation queries (following the principle of least privilege it may be possible to restrict this even more, but that is an exercise left up to the reader):

  1. Click "Customer Managed Policies"
  2. Create policy button
  3. JSON tab, and copy and paste the following:


{
"Version": "2012-10-17",
    "Statement": [
        {
            "Effect": "Allow",
            "Action": [
                "ce:*"
            ],
            "Resource": [
                "*"
            ]
        }
    ]
}


Figure 4:  Policy Creation via JSON

Group Creation
Now that the policy exists, create a Cost Estimator Group and assign it the newly created policy by performing the following steps:

  1. Click "Groups"
  2. Click Create New Group Button
  3. Name the group: CostEstimatorAPI
  4. Attach a policy:  CostExplorerPolicy
  5. Next
  6. Apply


User Creation
Now that the group exists, create a user and assign it to the newly created group by performing the following steps:

  1. Click "Users"
  2. Add user button
  3. Name the user
  4. Access type:  Programmatic access
  5. Select the CostEstimatorAPI Group we created
  6. Click next button
  7. Click Create user button


Figure 5:  User is created and tied to the group that has cost estimator permissions


Installing the aws2 Client

We installed the aws client on an Ubuntu Linux VM.  If you are using a different operating system, feel free to follow the instructions contained in the following documentation:  https://docs.aws.amazon.com/cli/latest/userguide/install-cliv2-linux.html

curl "https://awscli.amazonaws.com/awscli-exe-linux-x86_64.zip" -o "awscliv2.zip"

unzip awscliv2.zip

sudo ./aws/install


Now check the version, you might see something like the
/usr/local/bin/aws --version

You might see something like the following:
aws-cli/2.0.33 Python/3.7.3 Linux/4.4.0-31-generic botocore/2.0.0dev37

Note:  This needs to be version 2.x or higher for the cost explorer functionality to exist.

Configuring the aws2 Client

Note:  Have your AWS Access Key ID and AWS Secret Access Key ready from the Setup AWS Permissions section

aws configure

AWS Access Key ID [None]: AK[redacted]YY
AWS Secret Access Key [None]: vn[redacted][redacted][redacted]Rm
Default region name [None]: 
Default output format [None]: 

Using the aws2 Client

When using the aws client, you can use the following syntax to get help in trying to figure out how to achieve your goals.

  aws help
  aws <command> help
  aws <command> <subcommand> help

Be sure to also consult the docs for syntax help and example usage.  In our case, we are looking at cost explorer functionality:

Specifically for our example, we will look to retrieve the cost and usage information:
https://awscli.amazonaws.com/v2/documentation/api/latest/reference/ce/get-cost-and-usage.html

After a bit of trial an error to get the exact format of required parameters, we have the following:

aws ce get-cost-and-usage --time-period Start=2020-07-01,End=2020-08-01 --granularity MONTHLY --metrics "BlendedCost" "UnblendedCost" "UsageQuantity"

Which yields the following output:

{
    "ResultsByTime": [
        {
            "TimePeriod": {
                "Start": "2020-07-01",
                "End": "2020-08-01"
            },
            "Total": {
                "BlendedCost": {
                    "Amount": "xx.6272352241",
                    "Unit": "USD"
                },
                "UnblendedCost": {
                    "Amount": "xx.6272352241",
                    "Unit": "USD"
                },
                "UsageQuantity": {
                    "Amount": "xxx.1172177568",
                    "Unit": "N/A"
                }
            },
            "Groups": [],
            "Estimated": true
        }
    ]
}


Two things to note about the time period parameter (--time-period Start=2020-07-01,End=2020-08-01)
  1. It would be ideal if the aws client accepted terms such as:  "This year", "this month", "this week", or "today", but now that this is integrated into our third party tool, we can create that logic.
  2. But at least the client allows you to select a date in the future (ex:  The first of next month) for calculating the present time period.

Conclusion

We hope this article serves as a quick introduction and jumpstart to your interactions with the AWS API using the freely available client. While not perfect, this client is quite powerful and can be used to quickly interact with the Amazon Web Services API to build integrations into third-party tools.  Feel free to leave any comments in the section below.  Happy Hacking.


References

These are references which we found to be useful:

Saturday, January 7, 2017

Forensic Investigator Splunk App - Version 1.1.8

By Tony Lee and Kyle Champlin

The latest version of the Forensic Investigator app (version 1.1.8) is now available. We will only cover three major changes, but here are the rest of the details:
  • Added option to hide the MIR menus via the setup screen
  • Added proxy support to setup screen
  • Made vtLookup proxy aware
  • Made vtLookup accept and use non-default API key
  • Added CyberChef (En/Decoder -> CyberChef) - Big thanks to GCHQ for the awesome tool!
  • Added ePO Connector to control McAfee ePolicy Orchestrator
    • Requires editing bin\epoconnector.py and adding ePO IP, port, username, and password

1.  CyberChef

The folks over at GCHQ created an awesome encoding/decoding tool called CyberChef which is available here: https://gchq.github.io/CyberChef/. Even more impressive, it is a stand-alone client-side html page which was released under the Apache License version 2.0. We integrated it into the Forensic Investigator app as a useful component that can be utilized even on closed networks. Huge thanks to the developers at GCHQ.

CyberChef integrated into the Forensic Investigator App

2.  ePO Connector

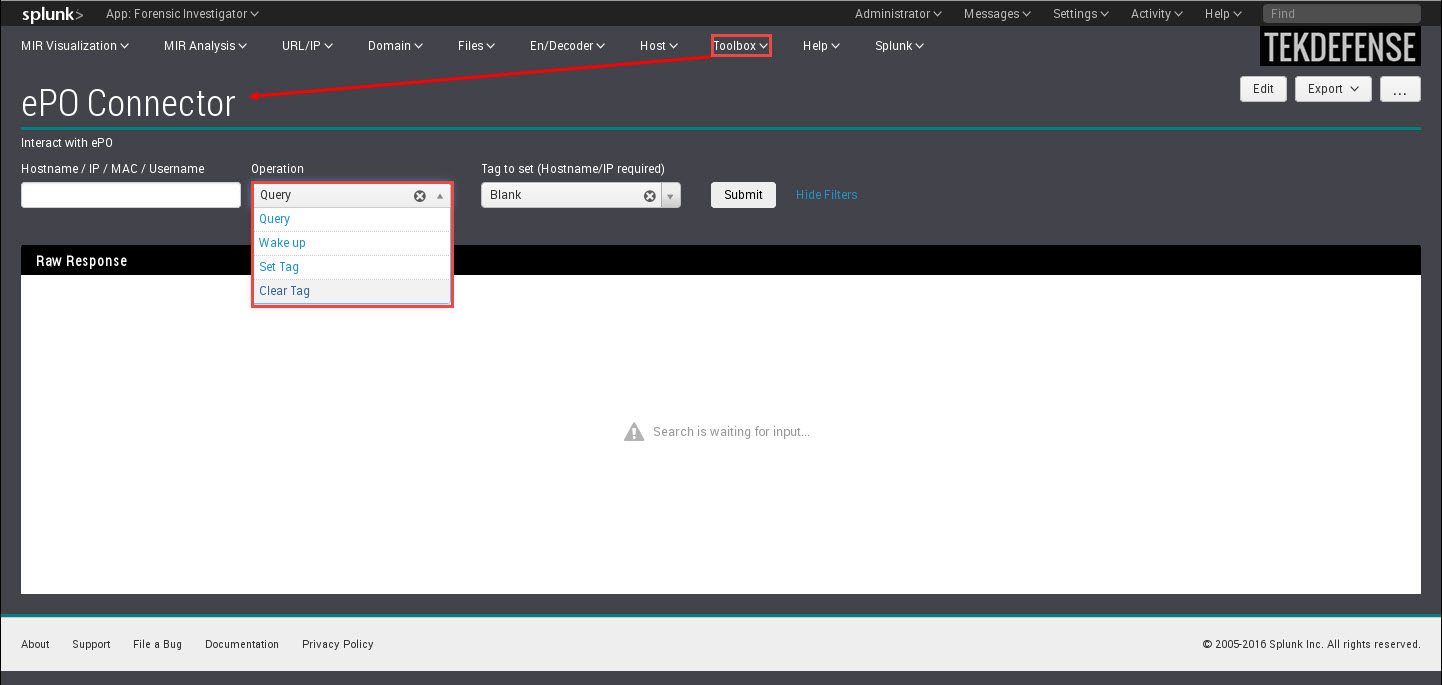
The Forensic Investigator ePO connector can be used to integrate Splunk and McAfee's ePolicy Orchestrator (ePO). This dashboard can task ePO via its API to do the following:
  • Query
  • Wake up
  • Set tag
  • Clear tag
This allows users to query for hosts using a hostname, IP addrses, MAC address, or even username. Then users can set a tag, wake the host up, and even clear a tag.  This feature is covered in more depth here:  http://securitysynapse.blogspot.com/2016/12/splunk-and-mcafee-epo-integration-part-ii.html

ePO connector feature

3.  Proxy Awareness

You spoke and we listened. The Virus Total Lookup feature in the app is now proxy aware. If this feature works well, we will make the rest of the app proxy aware too. To enable the proxy settings, use the setup screen (Help -> Configure App) and enter the required data found in the screenshot.

Proxy setup
Please let us know if you run into any issues with the proxy setup or if it seems to be working well for you.  We will use this information to tweak the setup screen in the next version of the app.

Conclusion 

We enjoy the feedback on the application--both good and bad, so please keep it coming. Let us know how you are using the application and how we can make it better.  Enjoy. :-)

Monday, December 26, 2016

Splunk and McAfee ePO Integration – Part II

By Tony Lee

In our previous article we outlined one method to integrate McAfee's ePolicy Orchestrator (ePO) with Splunk’s flexible Workflow actions. This allows SOC analysts to task ePO directly from Splunk. In this article, we will highlight a different and potentially more user friendly method. For convenience we have integrated this dashboard into version 1.1.8 of the Forensic Investigator app (Toolbox -> ePO Connector).


Forensic Investigator app ePO connector tool

As with the previous article, all that’s needed is the following:
  • Administrator access to Splunk
  • URL, port, and service account (with administrator rights) to ePO

Testing the ePO API and credentials

It still may be useful to first ensure that our ePO credentials, URL and port are correct. Using the curl command, we will send a few simple queries. If all is well, the command found below will result in a list of supported Web API commands.

curl -v -k -u <User>:<Password> "https://<EPOServer>:<EPOPort>/remote/core.help

If this failed, then check your credentials, IP, port, and connection. Once the command works, try the following to search for a host or user:

curl -v -k -u <User>:<Password> "https://<EPOServer>:<EPOPort>/remote/system.find?searchText=<hostname/IP/MAC/User>

Splunk Integration

The Forensic Investigator ePO connector dashboard contains the following ePO capabilities:

  • Query
  • Wake up
  • Set tag
  • Clear tag

This allows users to query for hosts using a hostname, IP addrses, MAC address, or even username. Then users can set a tag, wake the host up, and even clear a tag.

Setup

1)  Download and install
Before this integration is possible, first install the Forensic Investigator app (version 1.1.8 or later).

2)  CLI edit
Then edit the following file:

$SPLUNK_HOME/etc/apps/ForensicInvestigator/bin/epoconnector.py

Set the following:  IP, port, username, and password

theurl = 'https://<IP>:8443/remote/'
username = '<username>'
password = '<password>'

3)  Web UI dashboard edit
The dashboard is accessible via Toolbox --> ePO Connector.  There is a Quarantine tag present by default, but others can be added via the Splunk UI by selecting the edit button on the dashboard.


Lingering concerns

Using this integration method, there are a few remaining concerns:

  • The ePO password is contained in the epoconnector.py python script
    • Fortunately, this is only exposed to Splunk admins.
    • Let us know if you have another solution.  :-)
  • ePO API authentication uses Base64.  The resulting URL can be modified and it will still be authenticated and will issue commands to ePO.
    • SSL should be used with the ePO API to protect the communications
    • Limit this dashboard to only trusted users.
  • Leaving the system.find searchText parameter blank returns everything in ePO
    • ePO seems resilient even to large queries.  We also filtered out blank queries in the python script.
 

Conclusion 

This second ePO integration method should be quite user friendly and can be restricted to those who only need access to this dashboard. It could also be used in conjunction with out previous integration method too. Enjoy!

Sunday, December 18, 2016

Splunk and McAfee ePO Integration – Part I

By Tony Lee

Have you ever wanted to task McAfee ePolicy Orchestrator (ePO) right from Splunk? Lucky for us, ePO has robust Web API scripting capabilities and is well-documented in a reference guide found here:

Combine this with Splunk’s flexible Workflow actions and we have the basic building blocks to allow SOC analysts to task ePO. All that’s needed is the following:
  • Administrator access to Splunk
  • URL, port, and service account (with administrator rights) to ePO

Testing the ePO API and credentials

In order to start the integration, let’s first ensure that our credentials, URL and port are correct. Using the curl command, we will send a few simple queries. If all is well, the command found below will result in a list of supported Web API commands.

curl -v -k -u <User>:<Password> "https://<EPOServer>:<EPOPort>/remote/core.help

If this failed, then check your credentials, IP, port, and connection. Once the command works, try the following to search for a host or user:

curl -v -k -u <User>:<Password> "https://<EPOServer>:<EPOPort>/remote/system.find?searchText=<hostname/IP/MAC/User>

Pro Tips:
  • Do not leave the searchText parameter blank or it will return everything in ePO.
  • Machine readable output such as XML or JSON may be desired. 

To return XML or JSON, use the :output parameter as shown in the example below:

curl -v -k -u <User>:<Password> "https://<EPOServer>:<EPOPort>/remote/system.find?:output=json&searchText=<hostname/IP/MAC/User>

Our use case

There are many ways in which a SOC could benefit from Splunk/ePO integration. However, in this use case, we have ePO configured to perform automated actions (such as run a full AV scan) when certain tags are applied to hosts. Now wouldn’t it be convenient if we could tell Splunk to have ePO apply the tag to kick off the actions? How about clearing tags?  Both actions are exposed through ePO’s API:

Apply a tag: /remote/system.applyTag?names=<Host>&tagName=FullAVScan

Clear a tag: /remote/system.clearTag?names=<Host>&tagName=FullAVScan

Splunk Integration

One possible integration leverages Splunk’s Workflow Actions to issue these web API commands to ePO. This allows the analyst to pivot from the Event screen in a search using the Event Actions button as shown in the screenshot below:


Splunk’s Workflow actions can be setup using the following:
Settings -> Fields -> Workflow Actions -> Add New

(Note:  This example uses the field Hostname field to identify the asset, change this to match your field name):

Name:  FullAVScan
Label:  Run a FullAVScan on $Hostname$
Apply only to the following fields:  Hostname
Apply only to the following event types:  left blank 
Show action in: Both
Action type:  link
URI:  https://<User>:<Password> @<EPOServer>:<EPOport>/remote/system.applyTag?names=$Hostname$&tagName=FullAVScan
Open link in:  New window
Link method:  get

Note:  You may need to restart Splunk to make sure the Workflow Actions appear in the Event Actions drop down.


Security mitigations

This integration obviously exposes a lot of power to the Splunk analysts and potential attackers if Splunk is compromised.  Here are some steps that can be taken to limit abuse:


  • Create a specific service account in ePO for Splunk to use, do not reuse a user account
  • Limit access to the Workflow Action to a small group
  • Set a Network IP filter for the ePO/Splunk account to block any IP from using that account except the Splunk search head

Results:
The results that are returned from ePO depend on the action performed, however the message seems consistent.  See below for example messages for both a successful tasking and unsuccessful tasking.

Successful tasking:

OK:
1


Unsuccessful tasking:

OK:
0


Other possibilities


We have demonstrated the ability to query ePO for information by using hostname, IP address, MAC address, and user.  We also showed how it is possible to apply and remove tags.  But what else is possible?  You could ask ePO using the first test command used at the beginning of this article.

curl -v -k -u <User>:<Password> "https://<EPOServer>:<EPOPort>/remote/core.help


OK:
ComputerMgmt.createCustomInstallPackageCmd windowsPackage deployPath [ahId] [fallBackAhId]
[useCred] [domain] [username] [password] [rememberDomainCredentials]
ComputerMgmt.create.Custom.Install.Package.Cmd.short-desc
agentmgmt.listAgentHandlers - List all Agent Handlers
clienttask.export [productId] [fileName] - Exports client tasks
clienttask.find [searchText] - Finds client tasks
clienttask.importClientTask importFileName – Imports
--snip--


To obtain help on a specific API command, but the following syntax with the command parameter:

curl -v -k -u <User>:<Password> "https://<EPOServer>:<EPOPort>/remote/core.help?command=core.listQueries


OK:
core.listQueries
Displays all queries that the user is permitted to see. Returns the list of queries or throws on error.
Requires permission to use queries.


Troubleshooting

If issues arise, just use the curl command to eliminate complexity.  Verify credentials, IP, port, and connectivity, then move on to more complicated integration.

curl -v -k -u <User>:<Password> "https://<EPOServer>:<EPOPort>/remote/core.help


Lingering concerns

Using this integration method, there are a few remaining concerns.  There are:

  • The ePO password is contained in the Splunk Workflow setup screen
    • Fortunately, this is only exposed to Splunk admins.
  • ePO API authentication uses Base64.  The resulting URL can be modified and it will still be authenticated and will issue commands to ePO.
    • SSL in ePO should be used to protect the data
  • Leaving the system.find searchText parameter blank returns everything in ePO
    • ePO seems resilient even to large queries
  

Conclusion


This is just one example of what can be done when integrating Splunk and McAfee ePO. In our next article we will discuss further integration options using a little python and simple XML. We hope this was useful if you are ever tasked with integrating these two technologies.